Summary Experimental Research Methods: extensive summary with images & examples!
84 views 4 purchases
Course
Experimental Research Methods (424528B5)
Institution
Tilburg University (UVT)
A very extensive summary of the course Experimental Research Methods. All of the information & visualizations are representations of and based on all of the study materials of the course ERM of Tilburg University.
All of the tables/text with a black striped border are examples of questions/calcu...
Lecture 1 – Summary material previous courses and its relation to ERM
Descriptive statistics – summarize data. We use descriptive statistics because raw data can be very
confusing. There are two ways to summarize data;
1. With a distribution
2. With sample statistics
Data – numerical information about a population or sample.
- Population – all members of a defined group. Parameters are measures of characteristics of
the scores in a population and are indicated by Greek letters (𝜇, 𝜎, etc)
- Sample – subset of members of the population, because most of the time we are unable to
study the entire target group. Sample quantities are measures of characteristics in a sample
and are indicated by Latin letters (s, X, etc)
Distribution – summarizes data by grouping data with the same Creating a histogram and frequency
score. This can be done by using a frequency distribution or distribution in SPSS:
histogram. A histogram is less precise than a table. FREQUENCIES
VARIABLES=x
/HISTOGRAM
/ORDER=ANALYSIS
Sample statistics/quantities – data summarized using
characteristic features of the distribution of the data. Characteristic properties are;
1. Central tendency – the most characteristic score of a distribution. These measures are the
mean, mode and median.
- Mean – sum of all scores divided by the number of scores;
∑𝑁𝑖=1 𝑋𝑖
𝑋̅ =
𝑁
- Median – the middle number when the data is written down in a sequence from low
to high
- Mode – the number which occurs the most often in the data
2. Dispersion/spread – deviation of the scores from the characteristic score. Measures of
dispersion are;
- Range
- Variance – the sum of all squared deviation scores divided by the number of scores
minus one
2
𝑆𝑆 ∑𝑁 ̅ 2
𝑖=1(𝑋𝑖 − 𝑋 )
𝑠 = =
𝑁−1 𝑁−1
- Standard deviation – the square root of the variance
𝑠 = √𝑠 2
Inferential statistics – by using inferential statistics we can draw conclusions about a population
based on a sample. When we have data of the entire population, we do not need inferential
statistics. There are 3 different procedures in inferential statistics;
1. Hypothesis testing
2. Point estimation
3. Interval estimation
1
,There are several reasons why we mostly use data of a sample and not the population because it
either is too expensive, it takes way too much time to collect the data or because it simply is
impossible.
Hypothesis testing - examines whether the mean of the population is equal to a certain value or not.
Hypothesis are exclusive and exhaustive. Rules of thumb for creating a hypothesis are;
In the example on the right we discuss a two-sided test, because 𝐻1 contains ≠. In a one-sided test,
𝐻1 contains < or>.
The steps we take in hypothesis testing are;
1. Formulating the hypothesis 𝐻0 and 𝐻1
In this course we use an
2. Determining the decision rule to decide when a result is statistically
alpha level of 𝛼 = 0.05
significant; 𝑝 ≤ 𝛼.
3. Determine the p-value based on the SPSS output
4. Decision on significance and the conclusion T-test for the previous example:
T-TEST
/TESTVAL=2.5
/MISSING=ANALYSIS
Logic hypothesis testing /VARIABLES=x
/CRITERIA=CIN (.95)
- You make an assumption about the value of a parameter,
for example of the mean (=𝜇).
- Given that this value is true, you determine the possible values in the sample statistic (e.g. 𝑋̅)
can take in a simple random sample of 𝑁 cases
𝜎2
- The mean of the sample distribution is 𝜇, the variance is 𝑁
- Using that sampling distribution, you determine the probability (= the 𝑝-value), that the
value of 𝑋̅ or a more extreme value occurs
- In step 3 you determine the position of 𝑋̅ in the sampling distribution, so you also implicitly
determine the 𝑝 -value.
- If the 𝑝-value is lower than 𝛼, then you can conclude:
“If my 𝐻0 is true, then the probability that I observe this value for 𝑋̅ or an even more extreme value is
smaller than 𝛼. This probability is so small, that I do not trust my null hypothesis anymore. I reject
𝐻0 .”
- If the 𝑝-value is larger than 𝛼, then you can conclude:
“If my 𝐻0 is true, then the probability that I observe this value for 𝑋̅ or an even more extreme value is
quite large. I do not have enough reasons to doubt the correctness of 𝐻0 . Thus, I do not reject 𝐻0 .”
Note: one of the assumptions for hypothesis testing is that the sample is a simple random sample,
meaning that;
- All cases have an equal chance to be sampled
- Cases are selected independently of one another
2
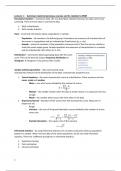
,One-sided vs. two-sided testing
The logic for a one-sided and two-sided test is the same, but
SPSS output is always two-sided. Thus we need to convert the
two-sided Sig. in SPSS output to the correct one-sided p-
value. We use the schema in figure 1 to determine how we
should interprate the Sig.
Point estimation – used to answer the following question:
“What is the best guess of this parameter?”, thus in other
words: which values lie closest to the population value? In
case of the mean (𝜇), the best guess is 𝑋̅. In the case of the
variance (𝜎 2 ), the best guess is 𝑠 2 . Figure 1 Decisions tree hypothesis testing
Interval estimation – with confidence intervals (CI), we can
answer the following question: “What is the interval in which the value of the parameter lies with …%
confidence?” With a 95% confidence interval for 𝜇 we can state: “In 95% of the times I draw a sample
of N=50, the confidence interval will contain 𝜇”. The formula for the confidence interval is:
𝑠
𝑋̅ ± 𝑡𝑐𝑣 ×
√𝑁
We can use confidence intervals to test two-sided hypotheses;
- If 𝜇𝐻0 falls in the 𝐶𝐼(1−𝛼)×100% , you cannot reject 𝐻0 in favour of a two-sided alternative
- 𝜇𝐻0 does not fall in the 𝐶𝐼(1−𝛼)×100%, you can reject 𝐻0 in favour of a two-sided alternative
Assuming that 𝐻0 is true…
… 95% of all possible samples will produce a 𝐶𝐼95 in which 𝜇𝐻0 falls, thus we can correctly
reject 𝐻0
… 5% of all possible samples will produce a 𝐶𝐼95 in which 𝜇𝐻0 does not fall, thus in which we
incorrectly reject 𝐻0 (=Type I error)
An alternative interpretation of the CI in relation with hypothesis testing:
“The 𝐶𝐼95 gives all hypothetical possible values for 𝜇 that are not rejected by the sample statistics
(given 𝛼)”
Testing means
Five different tests of means have been discussed in the previous statistics courses:
, All of these tests above are similar, as the following formula always holds:
𝑠𝑎𝑚𝑝𝑙𝑒 𝑠𝑡𝑎𝑡𝑖𝑠𝑡𝑖𝑐 − 𝑝𝑎𝑟𝑎𝑚𝑒𝑡𝑒𝑟
𝑡𝑒𝑠𝑡 𝑠𝑡𝑎𝑡𝑖𝑠𝑡𝑖𝑐 =
𝑠𝑡𝑎𝑛𝑑𝑎𝑟𝑑 𝑒𝑟𝑟𝑜𝑟
RQ: on average, do male and female students differ in their self-esteem?
1. Formulating hypotheses;
𝐻0 : 𝜇𝑀 = 𝜇𝐹
𝐻1 : 𝜇𝑀 ≠ 𝜇𝐹
2. Determining significance level;
𝑝 ≤ 𝛼 = 0.05
3. Determining p-value based on SPSS output;
Also always look at the Levene’s test! P-value is .062, which is larger than our alpha level of 0.05.
Thus we assume equal variances
4. Decision on significance and conclusion:
𝑝 = 0.105, which is larger than 𝛼 = .05, thus 𝐻0 cannot be rejected. Our conclusion is:
“Average self-esteem does not differ between male and female students”
In the course Experimental Research Methods tests 3 till 5 are of main importance.
Levene’s test – used to test equality of variances. Answers the question:
“Are the population variances of dominance equal for population A and population B?”
We test the following hypotheses for the Levene’s test;
𝐻0 : 𝜎𝐴2 = 𝜎𝐵2
𝐻1 : 𝜎𝐴2 ≠ 𝜎𝐵2
When we interpret the p-value, we can reject the null hypothesis, thus that there are no equal
variances, when the p-value is smaller than 𝛼 = .05.
In the SPSS output we can see a p-value of .468, which is larger than our alpha level; 𝑝 > 𝛼. Thus we
cannot reject 𝐻0 , which means that we assume equal variances. If the p-value would be smaller than
𝛼, we can reject 𝐻0 , which means that we cannot assume equal variances.
4
The benefits of buying summaries with Stuvia:
Guaranteed quality through customer reviews
Stuvia customers have reviewed more than 700,000 summaries. This how you know that you are buying the best documents.
Quick and easy check-out
You can quickly pay through credit card or Stuvia-credit for the summaries. There is no membership needed.
Focus on what matters
Your fellow students write the study notes themselves, which is why the documents are always reliable and up-to-date. This ensures you quickly get to the core!
Frequently asked questions
What do I get when I buy this document?
You get a PDF, available immediately after your purchase. The purchased document is accessible anytime, anywhere and indefinitely through your profile.
Satisfaction guarantee: how does it work?
Our satisfaction guarantee ensures that you always find a study document that suits you well. You fill out a form, and our customer service team takes care of the rest.
Who am I buying these notes from?
Stuvia is a marketplace, so you are not buying this document from us, but from seller sanne-simons. Stuvia facilitates payment to the seller.
Will I be stuck with a subscription?
No, you only buy these notes for $12.52. You're not tied to anything after your purchase.