This is a summary for the course Intermediate Microeconomics for the second semester of the second bachelor of the the study business Economics at the VUB. The summary is based on lectures, notes and the textbook.
Intermediate Microeconomics Summary: Business Economics Ba2
Chapter 1: Preliminaries
1. Microeconomics
Microeconomics is a branch of economics that deals with the behaviour of individual economic units as well as the markets that these units
comprise. Much about microeconomics is about limits (limited income & financial resources, number of hours allocated to labour or leisure) and
how to make the most of these limits, allocating the scare resources.
Individual economic units (firms, consumers) both have a limitation in income & financial resources. They need to use the income & financial
resources that is available in the most efficient way, make choices that maximizes their wellbeing. They are limitations, you cannot buy everything.
Consumers: Trade-offs in the purchase of more of some good for less of other goods (e.g. when you have an economy with only donuts and beer,
if you buy less donuts then you can buy more beer and vice versa), trade-off between current consumption and future consumption (e.g. Not
buying a new computer now in order to buy a new car in the future).
Workers: trade-offs in deciding when and whether to enter the workforce (one trades of working now for further education), Trade-offs in the
choice of employment (working for large corporations with job security or a smaller company with more opportunity to grow.
Firms: Trade-offs in what to produce, Trade-offs in the resources to use in production.
Positive (Analysis describing relationships of cause and effect, can be empirically tested) vs normative analysis (Analysis examining questions of
what ought to be, based on opinion)
2. Markets
A market is the collection of buyers and sellers that, through their actual or potential interactions, determine the price of a product or set of
products. A market is not the same as an industry -> an industry are all the firms that sell a particular good or service, the supply side of the
market and a market is more than the industry, it refers to both sellers & buyers. E.g. In the market for personal computers -> buyers are students,
Households or Business firms and the sellers are apple, HP, Dell or Lenovo.
Competitive (many buyers and sellers so they don’t have an impact on the price e.g. farmer for wheat) vs non-competitive markets (buyers and
sellers can have an impact on the price).
Market price = price prevailing in a competitive market.
The extend of a market are the boundaries of a market, both geographical and in terms of range of products produced and sold within it. We have
2 types of boundaries.
1) Geographic boundaries: Highly localized market versus a global market.
A local market constitutes of the customers who will buy products/services in the vicinity of where they are produced e.g. Chicago
Housing market -> most people who work downtown Chicago will look for housing within commuting distance or
McDonalds/burger King consist of many local markets -> people buy MCDO in the nearest Restaurant, they are not going to travel
for MCDO.
Global market: Buying or selling goods and services in all the countries of the world e.g. Gold is bought and sold in a world market.
The cost of transporting gold is small relative to its value.
A national market: Domestic marketplace for goods and services operating within the borders of and governed by the regulations
of a particular country, some goods can only be produced in a particular country e.g. Some beers can only be produced in Belgium.
2) Product range: Are products used for the same purpose or a different purpose? -> A city bike and a triathlon bike are both bikes but they are
not used for the same purpose, a city bike is used to drive to work and a triathlon bike is used to do triathlons.
E.g. They are is single market for cola and Pepsi (the market of beverages) and they are both used for the same purpose.
Why important?
1) Company decisions -> who are the actual and potential competitors of our company?
2) Public policy decisions -> Should we allow this merger?
3. Real versus nominal price
The nominal price of a good is its absolute price. The real price of a good is the price relative to an aggregate measure of prices (price adjusted for
inflation).
For consumer goods, the aggregate measure of prices most often used in the Consumer price index (CPI) -> records how the cost of a large market
basket of goods purchased by a “typical” consumer changed over time. The Producer Price index (PPI) records how prices change over time.
Chapter 2: The basics of supply and demand
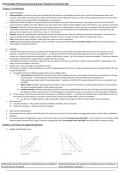
1. Supply and demand curve
Relationship between the quantity of a good that producers are willing to Relationship between the quantity of a good that consumers are willing to
sell and the price of the good. buy and the price of the good.
,Qs =Qs (P) Qd = Qd(P)
An upward sloping curve: The higher the price, the more firms quantity A downward sloping curve: the higher the price, the less quantity they
firms want to sell and vice versa-> positive relationship between price and want to buy and vice versa -> negative relationship between price and
quantity. quantity.
When the production costs -(decrease in the price of raw materials -> When the income -> Costumers can buy more -> more demand ->
increase in output for any given price -> shift of the supply curve to the demand curve shifts rights or when income -> Costumers can buy less ->
right or when production costs -> decrease in output for any given price less demand -> demand curve shifts left.
-> shifts of the supply curve left.
Movement along the supply curve when there is a change in price Movement along the demand curve when there is a change in price
2. Substitute and complementary goods
Changes in the prices of related goods also affect demand. Goods are substitutes when the increase in the price of one good leads to an increase
in the quantity demanded of another good e.g. copper and aluminium because one can be substituted for the other. Goods are complements
when an increase in the price of one leads to a decrease in the quantity of the other e.g. Auto’s and gas
3. The market mechanism.
When the supply and demand curve intersect, we get the equilibrium price (= Price that
equates the quantity supplied to the quantity demanded) and equilibrium quantity
Market tendency = Tendency in a free market for price to change until the market clears, for
the price to go back to the equilibrium price, that equates supply & demand.
Surplus = Situation in which the quantity supplied exceeds the quantity demanded
Shortage = Situation in which the quantity demanded exceeds the quantity supplied
A shift in both curves to the right, leads to a slightly higher price and a much larger quantity.
4. Effects of government intervention- Price controls
Without price controls, the market clears at the equilibrium price and quantity P0 and Q0. If the
price is regulated to be no higher than Pmax, the quantity supplied falls to Q1, the quantity demanded
increases to Q2, and a shortage develops.
E.g. If the demand for natural gas is perfectly inelastic and the government controls the price to be no
higher than Pmax then the price controls have no effect on the quantity demanded in the short run but
the quantity supplied will be lower -> supply < demand -> shortage
See notes for graph.
Chapter 3: consumer behaviour
, 1. Consumer theory
It’s about how consumers with a limited income make a choice to maximize their own well-being. Consumer choose the best market basket (or
bundle) they can afford.
What they can afford -> budget constraints
What is best -> consumer preferences
Optimal choice: The combination of what the consumer “can afford” and the “best (preferences” they have.
Optimal choice -> individual demand -> market demand.
Price- consumption curve:
Income- consumption curve:
Network externalities: Demand of one consumer is influenced by the demand of other consumers e.g. When your friends buys a new smartphone,
you might want one as well.
2. Market baskets
A market basket (or bundle) is a list with specific quantities of one or more goods.
Example: units of food and units of clothing per month.
Method of measurement largely arbitrary -> units
Two-goods assumption? -> Good 2 as “composite good”.
3. Consumer preferences: assumptions about preferences
1) Completeness: for an two market baskets A & B, a consumer will (1) prefer A to B, (2), prefer B to A, or (3) be indifferent between the two ->
preferences ignore costs! Customers are rational decision makers (decision making with reason and logic).
2) Transitive: if a consumer prefer market basket A to B, and prefers market basket B to C, then the consumer also prefers market basket A to C ->
Necessary for consistency!
3) More is better than less (non-satiation): Consumers always prefer more of any good to less. They are never satisfied, more is always better! ->
Exception: bads
4) Diminishing marginal rate of substitution -> C = -ΔC/ΔF = -(-6)/1 = 6
Indifference curve is convex if MRS diminishes along the curve.
4. Consumer preferences: indifference curves
Indifference curve: curve representing all combinations of market baskets that provide a consumer with
the same level of satisfaction. The indifference curve U1 that passes through market basket D shows all the
baskets that give the consumer the same level of satisfactions. Our consumer may prefer basket B which
lies above U1.
Indifference map: Graph containing a set of indifference curves showing the market baskets among which a consumer is indifferent.
3 properties of indifference curves
1) Downward sloping => If it is upward sloping than you cannot be indifferent between the basket since some
baskets provide then more satisfaction -> the assumption ‘more is better than less’ about preferences is
violated.
2) Cannot intersect => otherwise, the assumption ‘transitivity’ of preferences is violated.
If indifference curves U1 and U2 intersect then the consumer should be indifferent among market baskets A, B
and D. Yet B should be preferred to D because B has more of both goods.
3) Convex => Indifference curves are usually convex or bowed inward. Indifference curve gets flatter if you move
further to the right: “as food consumption increases, the slope of the indifference curve falls in magnitude”.
Indifference curve is convex if the Marginal Rate of Substitution (MRS) diminishes along the curve
5. Consumer preferences: Marginal rate of substitution (MRS)
MRS: maximum amount of a good that a consumer is willing to give up in order to obtain one additional unit
of another good. The magnitude of the slope of an indifference curve measures the consumer’s marginal rate
of substitution (MRS) between two goods.
In the graph, the MRQ between Clothing and Food falls from 6 between A & B to 4 between B and D.
MRQ = “Negative” of the slope of the indifference curve at any point. It’s the magnitude of the slope of the
indifference curve.
The MRS of food F for clothing C = The maximum amount of clothing that a person is willing to give up to
obtain one additional unit of food -> -ΔC/ΔF = -(-6)/1 = 6 -> he is willing to give up 6 units of food in
order to get one additional unit of food.
6. Consumer preferences: Perfect substitutes/complements
Perfect substitutes
Two goods for which the MRS is a constant number: MRS -> constant.
Indifference curves are linear and have a constant slope
Examples: red and blue pencils, Mastercard or Visa credit cards, orange juice
and apple juice, Coca-Cola and Pepsi.
Consumer buys the cheapest of the two goods.
Perfect complements
Two goods for which the MRS is zero or infinite: MRS -> zero or infinite.
Always consumed together in fixed proportion (not necessarily 1:1) -> e.g. one unit of good 1 for every two
units of good 2. Indifference curves are L-shaped -> examples: right shoes and left shoes, computers and
operating systems, portable gaming device and batteries.
7. Consumer preferences: Neutrals
The benefits of buying summaries with Stuvia:
Guaranteed quality through customer reviews
Stuvia customers have reviewed more than 700,000 summaries. This how you know that you are buying the best documents.
Quick and easy check-out
You can quickly pay through credit card or Stuvia-credit for the summaries. There is no membership needed.
Focus on what matters
Your fellow students write the study notes themselves, which is why the documents are always reliable and up-to-date. This ensures you quickly get to the core!
Frequently asked questions
What do I get when I buy this document?
You get a PDF, available immediately after your purchase. The purchased document is accessible anytime, anywhere and indefinitely through your profile.
Satisfaction guarantee: how does it work?
Our satisfaction guarantee ensures that you always find a study document that suits you well. You fill out a form, and our customer service team takes care of the rest.
Who am I buying these notes from?
Stuvia is a marketplace, so you are not buying this document from us, but from seller LukaBuggenhout. Stuvia facilitates payment to the seller.
Will I be stuck with a subscription?
No, you only buy these notes for $11.81. You're not tied to anything after your purchase.