During European Economic History tutorials, we focused on econometric interpretation of the papers. I decided to create one document that covers concepts about different models that are needed in order to be able to understand these questions. This can be useful for any other class that has econome...
Interpretation of the coefficients
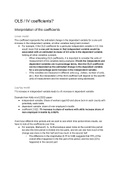
Linear model
The coefficient represents the estimated change in the dependent variable for a one-unit
increase in the independent variable, all other variables being held constant.
● For example, if the OLS coefficient for a particular independent variable is 0.5, this
would mean that a one-unit increase in that independent variable would be
associated with an estimated increase of 0.5 units in the dependent variable,
holding all other variables constant.
○ When interpreting OLS coefficients, it is important to consider the units of
measurement of the variables being analyzed. If both the independent and
dependent variables are in percentage terms, then the OLS coefficient
can be interpreted as the estimated change in the dependent variable
for a one percentage point increase in the independent variable.
○ If the variables are measured in different units (e.g., dollars, number of units,
etc.), then the interpretation of the OLS coefficient will depend on the specific
units of measurement and the research question being addressed.
Log-log model
1% increase in independent variable leads to x% increase in dependent variable
Example from Kelly et al (2022) paper:
● independent variable: Share of workers aged 60 and above born in each county with
potentially useful skills
● dependent variable: share of men employed in textile
● coefficient 2.022: 1% increase in share of workers with skills increase share of
men employed in textile by 2.022%.
If we have different time periods and we want to see which time period drives results, we
have to look at the coefficients over time.
● For example, Markevich, A., & Zhuravskaya paper looks at the overall time period,
but also this time period is divided into two parts, and we can see how much of the
change was done in the first half and how much in the second half.
○ The difference in the magnitudes (0.75 to 0.98) suggests that 75% of the
overall effect happened in the first part of the period, and the rest (22%)
happened in the second part
, How much of the change is explained by a specific independent
variable?
To understand how much of the effect in a regression is explained by each variable, you can
calculate the "variance explained" or "R-squared" value for each variable in the regression.
The partial R-squared represents the proportion of the variation in the dependent variable
that is explained by that variable alone, after controlling for the other variables in the model.
● To calculate the partial R-squared value for each variable, you can perform a
regression analysis with all of the independent variables in the model except for the
variable of interest, and calculate the R-squared value. Then, you can subtract that
R-squared value from the R-squared value for the full model with all of the
independent variables included. The resulting difference is the partial R-squared
value for that variable.
Significance of coefficients
Statistical significance: divide coefficient with standard errors and if it is larger than 1.95,
then it is significant at 5% level (this is t-test).
Economic significance: To assess the economic significance of a coefficient estimate, one
approach is to calculate the effect size of the independent variable on the dependent
variable by multiplying the estimated coefficient by the standard deviation of the
independent variable, and then dividing by the standard deviation of the dependent
variable.
IV instrument
Main reasons to be cautious when interpreting OLS results (example for institutions
and economic development, from Acemoglu paper):
1. REVERSE CAUSALITY: countries with better institutions develop more and better
developed countries develop better institutions
2. OMITTED VARIABLES: some unobserved factors that could affect development
3. BIASED, MEASUREMENT ERROR: post colonial view, where we already believe
that countries in Africa have bad institutions, assigning higher appropriation risk to
those countries
A valid instrument induces changes in the explanatory variable but has no independent
effect on the dependent variable, allowing a researcher to uncover the causal effect of the
explanatory variable on the dependent variable → Affecting dependent variable only through
independent variable.
● Relevance - If the IV is not significant in the first-stage regression, it indicates that
the IV may not be a good instrument for the endogenous variable
The benefits of buying summaries with Stuvia:
Guaranteed quality through customer reviews
Stuvia customers have reviewed more than 700,000 summaries. This how you know that you are buying the best documents.
Quick and easy check-out
You can quickly pay through credit card or Stuvia-credit for the summaries. There is no membership needed.
Focus on what matters
Your fellow students write the study notes themselves, which is why the documents are always reliable and up-to-date. This ensures you quickly get to the core!
Frequently asked questions
What do I get when I buy this document?
You get a PDF, available immediately after your purchase. The purchased document is accessible anytime, anywhere and indefinitely through your profile.
Satisfaction guarantee: how does it work?
Our satisfaction guarantee ensures that you always find a study document that suits you well. You fill out a form, and our customer service team takes care of the rest.
Who am I buying these notes from?
Stuvia is a marketplace, so you are not buying this document from us, but from seller isidoraknezevic. Stuvia facilitates payment to the seller.
Will I be stuck with a subscription?
No, you only buy these notes for $13.59. You're not tied to anything after your purchase.