100% satisfaction guarantee Immediately available after payment Both online and in PDF No strings attached
Previously searched by you
Summary Economic development: Finally what you were looking for: all-in-one document including the summaries and cue-cards for all lectures and all the 11 papers for this course!$16.95
Add to cart
Summary Economic development: Finally what you were looking for: all-in-one document including the summaries and cue-cards for all lectures and all the 11 papers for this course!
23 views 1 purchase
Course
Economic Development (EBM095B05)
Institution
Rijksuniversiteit Groningen (RuG)
This document was carefully made for students who want to have an excellent grade for this course. In addition to summarizing the 252 pages of the 11 papers, this summary summarizes all lectures and provides cue-cards for self-study.
The document has a 'Cornell' layout, meaning that it includes...
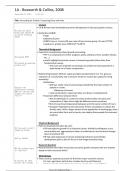
1A - Bosworth & Collins, 2008
September 12, 2022 11:22 AM
Title: Accounting for Growth: Comparing China and India
Context
• CH & IN have had remarkable economic development in the past quarter century.
WI special about
China and India? WI • Similarities CH&IN:
it worth studying
them? • large
• populous & poor
• 1980's low p.c. income (IN was mean of low-income group, CH was 2/3*IN)
• rapid econ. growth since 1980 (CH*7 & IN*2)
Theoretical Background
• Important considerations about growth accounting:
• TFP is a composite term (tech. progress, policy, political unrest, weather shocks,
WI behind TFP? etc...).
• results highlight proximate causes of economic growth (often other than
WI growth accounting fundamental causes).
useful for? ○ The main aim of growth accounting is to predict the future growth of a
state based on its factor composition.
• Relationship between GDP per capita and labor productivity ( ): gives an
indication of productivity and a measure similar to income per capita (for living
standards)
• Definitions:
○ GDP per capita: total income output divided by the total number of
Discuss the people in a state.
differences between ▪ Measure of income
GDP per capital and
output per capita ○ Labor productivity: output per labor unit (hour of employment).
(Y/L)… • Important difference between them:
○ Not all individuals in a state are active workers (labor structure and
composition of labor force might be different across countries)
▪ Not all countries/companies/employees work the same number of hours
▪ Example: Dependency ratio decreases if there are policies to reduce the
fertility rates. With a larger portion of the population in working age, there
are more labor force and a country can employ these people for economic
progress.
Empirical Background
• Paths to development taken by each:
WI the path to dev't • CN had explosive growth in its industrial sector, fuelled by willingness to act
taken by China?
more quickly and aggressively to lower its trade barriers and to attract foreign
direct investment FDI.
• IN had rapid expansion of service-producing industries (unorthodox
And by India?
development path as did not focus on low-wage manufacturing).
Research Question
WD the authors want • How do Chinese and Indian miraculous economic growth compare with one another
to find out? based on their structural shifts?
Methodology
• They construct separate accounts for the three major economic sectors:
W sectors do they • 1) 1ary: agriculture (which also includes forestry and fisheries);
divide the economy
into for the • 2) 2ary: industry (manufacturing, mining, construction, and utilities)
Econ. Development Page 1
,into for the • 2) 2ary: industry (manufacturing, mining, construction, and utilities)
analysis? • 3) 3ary: services.
• Data:
• Variables:
▪ Output: GDP from national accounts
▪ Physical capital: land, physical capital stock(?)
▪ Labour: Employment and average years of schooling
YI it important to ▪ Labour is essential because this exercise does not focus on the
control for labor in
a growth accounting capital in numeral terms (levels) but at the rate of growth of capital
exercise? per worker (share)
• Sources:
▪ K: IN from national accounts and CN from provincial reports
▪ H: IN from a the quiennial household survey. CN from an average of
estimates by Barro and Lee (2001) and Cohen and Soto (2001).
• 2 Periods analysed: Full period (1978-2004) vs 2 periods (w/ division in 1993)
because:
• benchmark year for IN national accounts
• 1991's crisis in IN
• 2nd period is post-reform era in IN
• Simplified econometric model: ln(Y/L) regression log log model based on a Cobb-
WI their econometric Douglas function
model?
• Specification:
WR the 2 periods • Theoretical base:
analyzed? ▪
▪ Where:
• : output
• : Total factor productivity (residual)
o not a production factor!
• Production factors:
WR the production o : physical capital
factor inputs covered
in a growth ◊ * though this model did not yield
accounting exercise? substantially different results, so this was added
to physical K
o : labor, adjusted for improvements in educational
attainment
◊ : proxy for skills (average years of schooling with
a constant marginal annual return of 7% assumed)
• : capital’s share of income
o assumed to be .4 for both countries
Findings
• Full period:
• average output growth per year:
In the full period: ○ CN: 9.3% growth per annum
HD China's growth
compare to that of ○ IN: 5.4% p.a.
India? • employment: nearly identical at 2% growth per year.
HD employment • Productivity ( ): CN much faster than rest of East Asia. IN at a comparable
developed?
rate.
H did labor
productivity
developed? • In a nutshell: proximate sources of growth during the period 1978-2004:
• China:
○ Has experienced a bigger growth due to the large contribution of total
HD the main proximate
sources of growth factor productivity and physical capital.
vary for China and ▪ A higher contribution of physical capital means that there is a faster
India? growth rate for capital per worker.
Econ. Development Page 2
,India? growth rate for capital per worker.
• We look at change in capital growth rate relative to labor
force:
○ Has a higher output growth because of the value of its sources that are
bigger than those of India
• India:
○ Mostly experienced some growth from the contribution of education.
• Contribution of physical capital (K) to economic growth:
• CN's physical capital contributed as much as 2x-3x to its development than that
HD the contribution
of physical K to of IN.
growth in China • IN's physical K contributed much less to growth than compared to that present
compare to that in in the investment-led rapid growth of East Asia, as opposed to CN that is
India?
comparable and even surpasses it.
HD the contribution
• Contribution of Human capital (H) to economic growth:
of Human K in India • IN is laggard in Asia with its growth of schooling. Though table shows
compare to that in comparable growth to Asian levels, their starting point was lower than average.
China? W were their
starting points?
• Surprisingly low returns to years of schooling was found in both countries,
though CN has largely eliminated illiteracy
HD the contribution • Contribution of Total Factor Productivity (A) to economic growth: In most East Asia,
of TFP compare to growth came mostly from investments in K. In both CN&IN, the most important source
those in Human and (~1/2 of gains in Y/L) came from gains in A (tfp).
Physical K? HD they
compare between
countries? • Sectors:
• Agriculture:
H has the ○ Both CN&IN had Green Revolutions
agricultural sector ○ CN also did a deep institutional shift towards a 'socialist' market economy'
developed in both ○ Growth rates p.y.:
countries?
▪ CN= 4.6%
W was the role of TFP ▪ IN= 2.5%
in output per worker ○ CN had a large growth via and (China's contribution to growth in
of agricultural
sectors of these agriculture was >2x IN's)
countries? ○ IN had a growth in productivity, though modest
HR agricultural jobs
○ Agricultural jobs are shrinking in CN and growing in IN (perhaps due to
developing? alternative job openings)
• Industry:
W drove growth of
○ Role in economies:
industrial labor ▪ ~1/2 of GDP in China
productivity (Y/L) in ▪ ~30% of GDP in India
China over 1978-2004?
And in India? ○ similar gains in but CN had larger gains in the contribution of
○ CN saw large growth (10% since 1993) thanks to growth of the
contribution of and , more than on employment
○ IN has very small , and even smaller gains in (~1%), so 1/2 of the
growth is attributed to the contribution of labor (employment)
• Services:
○ CN:
▪ services account for most of the growth in employment
▪ has grown at 5% p.y.
▪ Contribution of has increased as much for services as for
industry
▪ Contribution of has not increased much
○ IN: almost matching CN's performance
▪ Y grew at 5% p.y. in 1993-2004
▪ Very modest contribution of
▪ Large contribution of
Econ. Development Page 3
, • Sector shares:
HW the economy • 1978: CN focused (~48%) on industry and IN on agriculture (~44%), the other
structure in IN & CN sectors were similar sized
(in terms of sectors
shares) in 1978? • 2004: agriculture shrank by 20% in both.
○ CN: similar split between services and industry
○ IN: little growth in industry (mostly services)
And in 2004?
○ employment was ~70% in agro for both. Now IN has ~57% and CN ~47%
○ CN has more people in services
• Outputs relative to employment by sector:
WR the outputs • Both countries have average agricultural outputs relative to their employment.
relative to • IN has also average outputs from 2ary and 3ary sectors, but CN has oversized
employment by sector
in CN & IN? output in industry and undersized in services.
• Labor productivity:
W did the countries'
L productivity • 1978: Chinese labor productivity in each sector was only about 70 percent that
compared in 1978? for India.
And in 2004?
• 2004: Chinese output per worker in services, agriculture, and industry had risen
to 110, 130, and 220 percent of India’s levels, respectively.
WR the prospects for
future growth in
China and India? • Prospects for future growth:
W country is more • First prospect is to continue the resource reallocation (labor) into more
likely to grow more productive sectors (IN: services; CN: industry)
from education? • Education:
o Will let CN continue a rapid grow.
Will grow continue to o More of a challenge for IN.
be driven by capital • Capital:
accumulation in
China? o CN has a large capital pool (large savings rate + FDI inflows) that might
even slow down growth by misallocating capital into less productive
investments. India faces more capital constraints (growing savings rate but
W could be an large public deficit and less FDI – 1/2X CN’s)
alternative? ▪ Chinese growth led by contributions of capital is unlikely to continue
because capital has diminishing returns.
Will TFP continue to
increase? ▪ A future source of growth could be based on the large
improvements in human capital based on educational attainment
• TFP: will continue to increase, contributing to an overall economic development.
HC these countries
achieve higher • Opportunity for both: deepen their integration with global economy.
growth? o CN is largely exporting industrial/manufactured goods. Needs to prioritize
the creation of a domestic market, improving its financial system and
balancing their trade position (BoP).
o IN is doing so with services. They need to broaden it to agricultural and
manufactured goods as well to make use of their unemployed population.
Limitations:
•
Summary:
Econ. Development Page 4
The benefits of buying summaries with Stuvia:
Guaranteed quality through customer reviews
Stuvia customers have reviewed more than 700,000 summaries. This how you know that you are buying the best documents.
Quick and easy check-out
You can quickly pay through credit card or Stuvia-credit for the summaries. There is no membership needed.
Focus on what matters
Your fellow students write the study notes themselves, which is why the documents are always reliable and up-to-date. This ensures you quickly get to the core!
Frequently asked questions
What do I get when I buy this document?
You get a PDF, available immediately after your purchase. The purchased document is accessible anytime, anywhere and indefinitely through your profile.
Satisfaction guarantee: how does it work?
Our satisfaction guarantee ensures that you always find a study document that suits you well. You fill out a form, and our customer service team takes care of the rest.
Who am I buying these notes from?
Stuvia is a marketplace, so you are not buying this document from us, but from seller franciscobotero. Stuvia facilitates payment to the seller.
Will I be stuck with a subscription?
No, you only buy these notes for $16.95. You're not tied to anything after your purchase.