Summer MGT 6203 MID EXAM
PART2 – CODING
Week 1
Use the inbuilt dataset ‘longley’ for questions 1 and 2.
Q1) Fit a linear regression model with ‘Employed’ as the response
variable and all other variables (except ‘Year’) as predictors. What are the
significant predictors at 10% si...
summer mgt 6203 mid exam part2 – coding week 1 use the inbuilt dataset ‘longley’ for questions 1 and 2 q1 fit a linear regression model with ‘employed’ as the
Written for
Georgia Institute Of Technology
MGT 6203 Special Topics In Mgt
All documents for this subject (6)
Seller
Follow
ExamsConnoisseur
Reviews received
Content preview
Summer MGT 6203 MID EXAM
PART2 – CODING
Week 1
Use the inbuilt dataset ‘longley’ for questions 1 and 2.
Q1) Fit a linear regression model with ‘Employed’ as the response
variable and all other variables (except ‘Year’) as predictors. What are the
significant predictors at 10% significance level?
A. GNP
B. GNP, Armed.Forces
C. GNP, Unemployed, Population
D. None of the predictors are significant at 10% significance level
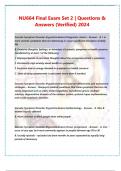
From the p-value, we can see that GNP and Armed.Forces are significant at 10%
significance level.
Q2) What can you say about multicollinearity in this model?
a. The model does not exhibit multicollinearity
b. The model exhibits multicollinearity due to high correlation between GNP,
Armed.Forces
, c. The model exhibits multicollinearity due to high correlation between GNP,
GNP.deflator and population
d. The model exhibits multicollinearity due to high correlation between GNP.deflator,
Unemployed
Yes, looking at the VIF table, we can see that GNP, GNP deflator and population have high
VIF values indicating multicollinearity issue. We may also look at the correlation matrix
to come to the same conclusion.
We can see that GNP, GNP deflator and population are highly correlated causing
multicollinearity issue.
Week 2
Q3) The trees dataset contains the girth (diameter), height, and volume for black cherry trees.
Download the dataset in R using the command “data(trees)”. Create two Linear-Linear
models. The first model should use girth to predict volume, and the second model should use
height to predict volume. What is the Adjusted R-Squared for each model.
A. 0.9471, 0.4334
B. 0.8243, 0.3265
C. 0.9331, 0.3358
D. 0.9798, 0.3292
,
The benefits of buying summaries with Stuvia:
Guaranteed quality through customer reviews
Stuvia customers have reviewed more than 700,000 summaries. This how you know that you are buying the best documents.
Quick and easy check-out
You can quickly pay through credit card or Stuvia-credit for the summaries. There is no membership needed.
Focus on what matters
Your fellow students write the study notes themselves, which is why the documents are always reliable and up-to-date. This ensures you quickly get to the core!
Frequently asked questions
What do I get when I buy this document?
You get a PDF, available immediately after your purchase. The purchased document is accessible anytime, anywhere and indefinitely through your profile.
Satisfaction guarantee: how does it work?
Our satisfaction guarantee ensures that you always find a study document that suits you well. You fill out a form, and our customer service team takes care of the rest.
Who am I buying these notes from?
Stuvia is a marketplace, so you are not buying this document from us, but from seller ExamsConnoisseur. Stuvia facilitates payment to the seller.
Will I be stuck with a subscription?
No, you only buy these notes for $11.49. You're not tied to anything after your purchase.