Six Sigma Practices Questions 2--(ASQ Practice Question Set) Complete Solutions.
Samenvatting/Summary The Certified Six Sigma Green Belt Handbook
All for this textbook (3)
Written for
Avans Hogeschool (Avans)
Technische Bedrijfskunde
Minor Continu Verbeteren
All documents for this subject (1)
Seller
Follow
jorgvandevondervoort
Content preview
The following is a sample data set: 10, 8, 8, 6, 5
What is the variance of this data set?
3.0
3.8
7.3
7.4
B 1
An auditor should use a histogram in a quality audit to do which of the following?
Provide objective evidence that the auditee uses statistical process control (SPC)
Expose patterns that are normally difficult to detect
Interpret data for a trend chart
Create a stratified tally diagram
B 2
Comparing how a process is actually performed against the documented work instruction for that process is
an example of which of the following techniques?
Quantitative
Qualitative
Statistical
Random sampling
B 3
Attribute sampling should be used when
the data are measurements in metric units.
a yes-or-no decision is to be made.
the population has variability.
a multi-stage sampling plan is needed.
B 4
Scatter diagrams are best described as
histograms.
correlation analysis.
Pareto analysis.
Ishikawa diagrams.
B 5
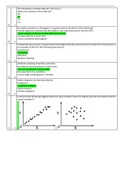
In which of the following diagrams does the input variable X have the highest positive correlation with the
output variable Y?
A 6 A B
, C D
7
If data are plotted over time, the resulting chart will be a
run chart
histogram
Pareto chart
Poisson distribution
A 8
To determine who are or might be customers for a specific process, it would be most useful to create a
Pareto chart
flow diagram
cause and effect diagram
scatter diagram
B 9
A production line uses signs at specific points on the line to indicate when components or raw materialsneed
to be replenished. This practice is an example of
kanban
poka-yoke
checkpoints
hoshin
A 10
Which of the following is a good tool for planning cycletime reduction and concurrent operations?
A timeline
A Pareto diagram
An X and R chart
A PERT chart
D 11
Attribute and variable data are best described as which of the following?
Attribute | Variable
Counted values | Measured values
Counted values | Visual features
Measured values | Counted values
Visual features | Counted values
A 12
All of the following are common ways for people to react to conflict EXCEPT
competing
collaborating
avoiding
sabotaging
D 13
, A quality manager has chosen to survey customer satisfaction by taking samples based on the categories of
frequency of use, categories of use, and demographics.
This technique is known as
random sampling
data collection
stratification
customer classification
C 14
Which of the following actions is NOT used to reduce process cycle time?
Analyzing current processes
Reducing queue times
Setting priorities
Implementing activity-based costing
D 15
A company’ s accounts payable department is trying to reduce the time between receipt and payment of
invoices and has recently completed a flowchart. Which of the following tools would be the best for them to
use next?
Fishbone diagram
Scatter diagram
Box and whisker plot
Histogram
A 16
In a manufacturing company, the machine shop is what kind of customer in relation to the human resource
department?
Intermediate
Hidden
External
Internal
D 17
The primary purpose of a project charter is to
subdivide the project into smaller, more manageable components
provide management with a tool for selecting a project that addresses business needs
provide management with a tool to ensure that project deadlines are met
provide the project manager with authority to apply organizational resources to project activities
D 18
Sample selection of parts for inspection must be selected at random to ensure
a minimum sample size.
the probability of not rejecting the lot.
the probability of accepting the lot.
finding typical characteristics of the lot.
D 19
Which of the following are bases for establishing calibration intervals?
I. Stability
II. Purpose
III. Degree of usage
I and II only
I and III only
II and III only
I, II, and III
D 20
, In a normal curve, approximately what percentage of the area is included within 3 standard deviations ofthe
mean?
50.0%
66.6%
95.0%
99.7%
D 21
Specification limits are derived from which of the following?
Process capability studies
Process control charts
Customer requirements
Historical data
C 22
The primary purpose of a control chart is to
set specifications and tolerances.
compare operations.
determine the stability of a process.
accept or reject a lot of material.
C 23
When a control chart is used on a new process, capability can be assessed at which of the following times?
Before the chart is first started
After the first ten points are plotted
When the plotted points hug the centerline
After the process is shown to be in control
D 24
Precision is best described as
a comparison to a known standard
the achievement of expected outgoing quality
the repeated consistency of results
the difference between an average measurement and the actual value
C 25
The overall ability of two or more operators to obtain Consistent results repeatedly when measuringthe same
set of parts and using the same measuring equipment is the definition of
repeatability
precision
reproducibility
accuracy
C 26
Which of the following conditions must be met for a Process to be in a state of statistical control?
Most of the product output by the process is in specification.
All subgroup averages and ranges are within control limits.
All variation has been completely removed.
Previously optimal process settings are used.
B 27
Which of the following measures of dispersion is equal to the sum of deviations from the mean squared
divided by the sample size?
Range
Standard deviation
Variance
Mode
C 28
The benefits of buying summaries with Stuvia:
Guaranteed quality through customer reviews
Stuvia customers have reviewed more than 700,000 summaries. This how you know that you are buying the best documents.
Quick and easy check-out
You can quickly pay through credit card or Stuvia-credit for the summaries. There is no membership needed.
Focus on what matters
Your fellow students write the study notes themselves, which is why the documents are always reliable and up-to-date. This ensures you quickly get to the core!
Frequently asked questions
What do I get when I buy this document?
You get a PDF, available immediately after your purchase. The purchased document is accessible anytime, anywhere and indefinitely through your profile.
Satisfaction guarantee: how does it work?
Our satisfaction guarantee ensures that you always find a study document that suits you well. You fill out a form, and our customer service team takes care of the rest.
Who am I buying these notes from?
Stuvia is a marketplace, so you are not buying this document from us, but from seller jorgvandevondervoort. Stuvia facilitates payment to the seller.
Will I be stuck with a subscription?
No, you only buy these notes for $3.94. You're not tied to anything after your purchase.