Summary Articles Culture and Institutions (General + business track)
43 views 4 purchases
Course
Culture and institutions (MANBCU344)
Institution
Radboud Universiteit Nijmegen (RU)
Atricles of C&I:
Literature Part A & B
1. Beugelsdijk, S., & Maseland, R. (2011). Culture in economics: History, methodological reflections and contemporary applications. Cambridge University Press.
2. Alesina, A., Algan, Y., Cahuc, P. and Giuliano, P. (2015), Family Values and the Regulation...
Business Administration: International Business Administration
Culture and institutions (MANBCU344)
All documents for this subject (1)
Seller
Follow
kiaracillekens
Content preview
Alesina, A., Algan, Y., Cahuc, P. and Giuliano, P.
Family Values and the Regulation of Labor.
Introduction
To be efficient, flexible labor markets require geographically mobile workers. Otherwise, firms can
take advantage of workers’ immobility and extract rents at their expense. to limit the rents of firms and
to avoid moving, individuals with strong family ties rationally choose regulated labor markets, even
though regulation generates higher unemployment and lower incomes.
Flexible labor markets require that individuals move geographically in order to maximize their
opportunities, find the best match with a firm, and get the best-paid job, however in certain cultures,
staying close to family is important and the mobility required by a free labor market is painful.
Workers with strong family ties would favor regulation to counteract this power 2 equilibria
1. laisse-faire = high mobility and unregulated labor markets, which occurs when family ties are
weak
produces higher per capita income, rareifies family relations
2. regulated labor markets = labor market rigidity comprising minimum wage and firing
restrictions.
Given the cultural value place on family ties, labor market regulation can be preferrable laissez-faire
Paper insights
- Model implies a two-way effect between families ties and labor market regulation
- Interaction between family ties, labor market institutions and outcomes
Findings
Individuals who inherit stronger family ties are less mobile, have lower wages and higher
unemployment, and support more stringent labor market regulations. We find a positive association
between labor market rigidities at the beginning of the 21st century and family values prevailing
before World War II, and between family structures in the Middle Ages and current desire for labor
market regulation. Both results suggest that labor market regulations have deep cultural roots.
- positive correlation between desire for regulation and family ties
- results show a strong relationship between family ties and labor market regulation that goes
through the demand for regulation
- second-generation immigrants coming from famillistic societies are less mobile, face a wage
and employment penalty, and also ask for more government regulation of wages and job
security.
- the strength of family values inher-ited from the countries of origin before World War II is
positively correlated with the stringency of labor market regulation in the countries of origin at
the beginning of the 21st century
- t the country level, the relationship between actual regulation and family values goes through
an individual desire for regulation influenced by transmission of cultural values.
- Figure 1 shows the positive cross-country correlation between the two measures of labor
market regulation (firing costs and the minimum wage) and the objective indicator of family
ties, measured by the fraction of young adults living in the parental home.
- family ties are related not only to labor market regulation but also to the demand for such a
regulation
Labor market deregulation requires geographical mobility, otherwise firms can take advantage of the
immobility of workers and extract rents. However, geographical mobility requires relatively weak
family ties. That is, individuals should not experience a too high utility loss if they need to move away
from their family of origin. Such costs may be high in cultures that value family ties and family
closeness. As a result, countries with strong family ties rationally favor a host of labor market
regulations, in order to restrict the monopsony power of firms.
Family values may evolve over time, albeit slowly. In places with laissez-faire labor markets, parents
have an incentive to teach children the benefits of mobility. In countries with regulated labor markets,
,the benefits of mobility are much lower and parents can, if they choose to do so, teach the value of
family ties, since they come at lower or no cost. Thus we can have two equilibria, with two-way
causality between family ties and labor market regulation.
We investigate this correlation between family values and attitudes toward labor market regulation and
preferences for job security versus a free labor market using cross-country evidence, individual-level
evidence drawn from immigrants in the United States, and evidence about persistence in family
structures going back to the Middle Ages. In all cases, we found rather strong support for the theory.
The correlation between labor market regulation and relatively slow-moving cultural traits regarding
the family, and the fact that labor market regulation is complementary to certain family values, explain
the difficulty in liberalizing labor markets. In a sense, the relatively lower employment and
inefficiency associated with labor market regulation is the price that certain countries choose to pay in
order to enjoy the benefits of family ties and closeness.
Differences in family ties could also have broader implications for the overall desire of regulation in a
society—for example, individuals with strong family ties could support stringent product market
regulations that limit the entry of foreigners. This point, together with a more complete analysis of the
evolution over time of institutions in countries with different family arrangements, is left for future
research.
,Kumon, Y. (2021).
The deep roots of inequality
Intro & Data
Introduction
The paper measures long-run inequality in landownership in pre-industrial rural Japan in 1640 to
1870, using new data from 586 villages, focusing on the distribution of lands because that was the
most important form of wealth in the pre-industrial context.
We will be talking about the methodology of the paper, the inequality estimates, inequality levels,
international comparisons and an explanation of the inequality, whilst rounding off with the
conclusions, discussions and a selection of submitted questions.
Data
The paper’s main source of data is a dataset consisting of Japanese village censuses (volkstellingen) to
measure inequality in landownership. The dataset covers 586 villages with sporadic observations
between the year 1634 to 1872. The population censuses were compiled annually by all villages in
Japan by order of the lords. The censuses involved names, ages, household compositions and a
declaration of religion, in order to rule out Christians even though it only was a minority in Japan.
The three main sources used in the paper are:
1. Publications of local historic information which were digitized;
2. ‘Population and Family History Project’
3. An online database of Hiroshi Kawaguchi entitled DANJURO.
The author states that 84 villages were more intensely investigated by means of multiple observations
in two subsequent decades to try and find time trends. However, data of some villages is said to be
inconsistent, reappearing and disappearing over the years and decades.
As shown in the geographic figure, the observations on the main island of Honshu covers 80% of the
population. However, it unsurprisingly lacks observations in the areas where mountains are located,
which are said to be over two thirds of the land. On the other hand, the author states that the data of the
islands Shikoku and Kyushu need to be interpreted with caution as the sample size is considerably
smaller.
The data is said to have contained outdated tools of measurement as the increased plot size or
increased productivity was never updated over time. Therefore, Kumon (2021) created an equation for
landownership which calculated the land rent net of tax in each year:
Legend:
Land rent net of tax = the economic value of owning the land.
Yield = the value of the yield in period 0 when yields were measured.
∆Prod = the change in productivity since the measurement of yield and period ‘t’.
α i,t = uncontrollable factors which could affects land prices, such as yield risk (these
factors also include any investments or depreciations on the plot that affects the value).
Land rental rate = implicit or explicit share of yield given to landowner in return for his rights.
Tax rate = amount paid by landowner to the landlord in proportion to the official yield.
, Kumon (2021) then states that, as he is measuring inequality which accounts on landownership
relative to the total land owned, there would be no issue if the relative value is a function of the
official yields multiplied by a constant or where ‘γv,t’ is constant within a village year. This would
also be the case if the same changes occurred in a village in terms of productivity, land rental rates and
tax rates. However, it was not possible to assume that ‘γv,t’ was constant across villages in a certain
year due to differences in tax rates which impedes inequality measures outside village level.
Another weaker assumption in the research was that ‘γv,t’ was constant in the village. Yet, this
assumption raised two concerns:
- Did the land rent per official yield (∆prod_i,t × land rental rate_i,t) vary across plots?
- Did tax rates per official yield vary across plots?
- ‘γv,t’ was constant in the village The assumptions were tested by means of 64 land records
from large landowners who recorded the land rent, land tax, and official yield of their plots.
The figure on the right shows the land rent and land tax for plots of land owned by two landowners. It
can be seen that the land tax is close to perfectly correlated with the official yield, confirming that the
land tax was a fixed rate based on the official yield. Therefore, it could be assumed that the tax rate
was constant within each village-year.
Inequality estimates
Time trends
Kumon (2021) then goes on to look at the time-
trends in inequality using the long-run data from 76
Japanese villages within the time period of 1647-
1872. Because there is the possibility for
heterogeneity between those, the paper decides to
estimate both in aggregate and by region. As can
be seen in the figure on the right, there is much
heterogeneity in inequality trends, probably
because of local phenomena. But when looking at
the overall picture, there does not appear to be
much trend in aggregate, with west and east near to
zero, while central has increasing inequality and northeast decreasing inequality. There is only a
marginal significance in two of the regions, it being central and northeast, but these are not showing
the same trends. Therefore Kumon (2021) decides to test the famine years, because the figure does not
show the trends which it was associated with. After his analysis, it was concluded that, with the
methodology which Kumon (2021) uses, there was no hidden gradual increase in inequality. When
looking at the landownership outside the village, there was no evidence found for increased external
holdings, which are pieces of land owned outside the
village which they are living in.
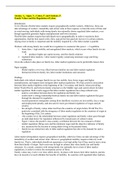
Kumon (2021) then delivers a comparison, by
conducting a similar analysis of 18 rural Italian
villages within the time period of 1307-1809. The
graphs of these villages, split into regions, can be
seen in the figure on the right. However, for the
The benefits of buying summaries with Stuvia:
Guaranteed quality through customer reviews
Stuvia customers have reviewed more than 700,000 summaries. This how you know that you are buying the best documents.
Quick and easy check-out
You can quickly pay through credit card or Stuvia-credit for the summaries. There is no membership needed.
Focus on what matters
Your fellow students write the study notes themselves, which is why the documents are always reliable and up-to-date. This ensures you quickly get to the core!
Frequently asked questions
What do I get when I buy this document?
You get a PDF, available immediately after your purchase. The purchased document is accessible anytime, anywhere and indefinitely through your profile.
Satisfaction guarantee: how does it work?
Our satisfaction guarantee ensures that you always find a study document that suits you well. You fill out a form, and our customer service team takes care of the rest.
Who am I buying these notes from?
Stuvia is a marketplace, so you are not buying this document from us, but from seller kiaracillekens. Stuvia facilitates payment to the seller.
Will I be stuck with a subscription?
No, you only buy these notes for $9.57. You're not tied to anything after your purchase.