Mandatory readings
Chapter 3: The Theory of Environmental Externalities, p. 42-85.
Focus questions:
1. How can pollution and environmental damage be represented in economics?
2. What economic policies can be instituted to respond to environmental problems?
3. How and when can property rights be relied upon to solve environmental problems?
Externalities are defined as impacts that affect the well-being of those outside of a market transaction.
● Negative externality = negative impacts of market transaction affecting those not involved in the
transaction e.g. pollution
○ If markets operate without regulation, the production decisions will not account for
social/ecological damages of pollution.
● Positive externality = positive impacts of a market transaction that affect those not involved in the
transaction e.g. landowners buying and planting trees
○ the trees also provide benefits to the society bc trees provide carbon sequestration/habitat for
wildlife/aesthetics.
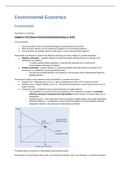
Demand and supply curves represent costs and benefits of a market transaction.
● Supply curve = Marginal cost curve (i.e., costs of producing one more unit of a good or service)
● Demand curve = Marginal Benefit curve (i.e., the benefit of producing or consuming one more unit of a
good or service)
● Intersection point = Equilibrium price at which demand and supply balance
○ This equilibrium (at a price of Pm and a quantity of Qm) represents a situation of economic
efficiency because it maximizes the total benefits from the market—but only if there are no
externalities.
○ Equilibrium price = the market price where the quantity supplied equals the quantity demanded
○ Economic efficiency = an allocation of resources that maximizes net social benefits; perfectly
competitive markets in the absence of externalities are efficient
The graph does not account for externalities (external/social costs)
Accounting for environmental costs (costs, not necessarily monetary, that is not reflected in a market transaction)
, ● First we need to put monetary values on environmental damages
● Then add the external costs to the production costs to obtain the total social cost
● This results in a social marginal cost curve = the cost of providing one more unit of a good or service,
considering both private production costs and externalities
● This new curve is above the original market supply curve because it now includes the external costs;
vertical distance between the two cost curves is our estimate of the external costs (assumed to be
constant bc the curves are parallel)
● Because of negative externalities the market equilibrium is not economically efficient anymore! The
demand curve is above the social marginal cost curve, even though the first automobile creates
negative externalities (theoretically, the high marginal benefits justifies producing that automobile). Thus,
the equilibrium outcome is inefficient in the presence of a negative externality
● The optimal level of production is Q*
● THe market price is too low from the society perspective as it fails to reflect the true social costs
(environmental impact). The socially efficient price for automobiles is higher, at P*.
● Socially efficient = a market situation in which net social benefits are maximized
Internalizing externalities = bringing the external costs into market analysis = using approaches such as taxation
to incorporate external costs into market decisions.
● Pivogian (pollution) tax approach = polluter pays principles = government regulation in the presence of
negative externalities = effective policy tool for reaching a more efficient outcome for society
● Pivogian tax = a per-unit tax set equal to the external damage caused by an activity, such as a tax per
ton of pollution emitted equal to the external damage of a ton of pollution
● Polluter pays principle = the view that those responsible for pollution should pay for the associated
external costs, such as health costs and damage to wildlife habitats (i.e., those responsible for pollution
pay for the damages they impose upon society)
● Tax increase marginal production costs (tax shifts the private marginal cost curve upward)
● “Correct tax amount” ⇒ if we set the Pigovian tax exactly equal to the externality damage associated
with each automobile, then the marginal cost of production would equal the social marginal cost curve
● Correct tax amount = the tax per unit should equal the externality damage per unit = those responsible
for pollution should pay for the full social costs of their actions
● The market will adjust to the Pigovian tax by shifting to a new equilibrium, with a higher price of P* and a
lower quantity of Q*
● Note: even though the tax was levied on producers, a portion of the tax is passed on to consumers in
the form of a price increase for automobiles (from Pm to P*). This causes consumers to cut back their
purchases from Qm to Q*.
,This is the market with Pigovian tax = external damages & where marginal costs of production = social marginal
costs.
Though, consumers will pay a higher price and producers will have lower sales because of the tax, the outcome
of the socially optimal equilibrium is a good result from a social point of view (it accurately reflects the true
costs of production).
Two factors why we should not put a Pigovian tax on all products:
● Some products cause relatively minimal environmental damages, and the small amount of taxes
collected may not be worth the costs of estimating the “right” tax (estimating the tax amount in monetary
value)
● High administrative costs of imposing and collecting the tax (if a product does not cause much
environmental damage, then these costs might outweigh the revenues we would collect)
Upstream tax = a tax implemented as near as possible to the point of natural resource extraction.
● Economists generally recommend applying Pigovian taxes as far upstream in the production process as
possible rather than looking at the final consumer product
● An upstream tax is imposed at the level of the raw production inputs e.g., putting Pigovian tax on cotton
used to make a shirt, which reflects in the selling price.
● Focus tax on raw production that cause the most widespread ecological damage ⇒ limits administrative
complexity of tax collection & avoids the need for estimating the appropriate tax for a multitude of
products.
How is the tax distributed between producers and consumers depends on the elasticities of supply and demand
with respect to price
● Elasticity of supply = the sensitivity of quantity supplied to prices; an elastic supply means that a
proportional increase in prices results in a larger proportional change in quantity supplied; an inelastic
supply means that a proportional increase in prices results in a small change.
● Elasticity of demand = the sensitivity of quantity demanded to prices; an elastic demand means that a
proportional increase in prices results in a larger proportional change in quantity demanded; an inelastic
demand means that a proportional increase in prices results in a small change.
Tax can fall disproportionately on certain income groups as most environmental taxes hit low-income households
the hardest.
Thus, issues related to our externality analysis are:
1. Putting taxes on all products is hard
2. Tax distribution between consumers and producers
3. Tax can fall disproportionately on certain income groups
, Note: As with a negative externality, an unregulated market will also fail to maximize social welfare in the
presence of a positive externality. Similarly, a policy intervention will be required to reach the efficient outcome
● Incorporating positive externality in graph ⇒ upward shift of the demand curve. This new curve
represents the total social benefits of each unit
● Figure below: each solar panel installed reduces emissions of carbon dioxide and other pollutants, and
thus benefits society as a whole
● The positive externality per solar panel = the vertical distance between the market demand curve and
the social marginal benefits curve
● Social benefits = constant per panel (two benefit curves are parallel)
● Market equilibrium = Pm;Qm & optimal level of solar energy is Q*
● In the case of a positive externality, the most common policy to correct the market inefficiency is a
subsidy.
● Subsidy = government assistance to an industry or economic activity; subsidies can be direct, through
financial assistance, or indirect, through other beneficial policies = a payment to a producer to provide
an incentive for it to produce more of a good or service or they are paid to consumers to encourage
them to purchase particular goods and services
● Incentive = aansporing = prikkel = stimulans
● “Correct subsidy” ⇒ lowers the supply curve such that the new market equilibrium will be at Q*, which is
the socially efficient level of production
● The socially efficient equilibrium quantity Q* could also be achieved with a subsidy to consumers for
buying solar panels, such as a tax credit. This would have the effect of shifting the demand curve up and
to the right, leading to a higher market price but a lower effective price to consumers due to the subsidy,
and the same equilibrium quantity as with a producer subsidy
The benefits of buying summaries with Stuvia:
Guaranteed quality through customer reviews
Stuvia customers have reviewed more than 700,000 summaries. This how you know that you are buying the best documents.
Quick and easy check-out
You can quickly pay through credit card or Stuvia-credit for the summaries. There is no membership needed.
Focus on what matters
Your fellow students write the study notes themselves, which is why the documents are always reliable and up-to-date. This ensures you quickly get to the core!
Frequently asked questions
What do I get when I buy this document?
You get a PDF, available immediately after your purchase. The purchased document is accessible anytime, anywhere and indefinitely through your profile.
Satisfaction guarantee: how does it work?
Our satisfaction guarantee ensures that you always find a study document that suits you well. You fill out a form, and our customer service team takes care of the rest.
Who am I buying these notes from?
Stuvia is a marketplace, so you are not buying this document from us, but from seller maximekaan28. Stuvia facilitates payment to the seller.
Will I be stuck with a subscription?
No, you only buy these notes for $7.94. You're not tied to anything after your purchase.