ARMS Advanced Research Methods and Statistics (202200104)
Institution
Universiteit Utrecht (UU)
This summary contains all the material from the Grasple lessons provided by the University Utrecht for the course ARMS. It includes material needed for the skills exam (e.g. how to do analyses), but also material for the theory exam. Important concepts are (bold) colored or instructions in italics...
advanced research methods and statistics for psychology
Written for
Universiteit Utrecht (UU)
Psychologie
ARMS Advanced Research Methods and Statistics (202200104)
All documents for this subject (25)
3
reviews
By: liz_bos • 1 year ago
By: jasmyna_94 • 1 year ago
By: naomivdaalen • 1 year ago
Seller
Follow
Samenvattingenvoorieder
Reviews received
Content preview
Summary Grasple lessons ARMS
Grasple week 1 Bayes and MLR
The Bayesian framework is based on the posterior distribution of one or more parameters. The
posterior is a combination; prior + likelihood
the information in the data set gives information, for what logical values for μ (the mean) could
be: likelihood function
We also have the knowledge and beliefs about μ, before examining the data: prior distribution
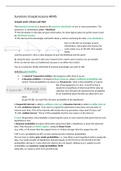
Here on the left are examples of prior
distributions, which gives the chances for
some values (e.g. on the left, all is equally
likely)
(and the posterior is thus a value between de μ of the likelihood and the prior)
By using the prior, you don’t start your research from scratch and so science can accumulate.
(Prior can also be seen as a bottleneck, because it can affect the results)
You as a researcher decide what kind of previous knowledge you want to add
Definition of probability:
In classical/ frequentist statistics: the frequency with which it occurs
In Bayesian statistics: is it based on Bayes theorem, where conditional probabilities are
central. These probabilities are about e.g. P(A given B); ‘what is the probability of A given
that B has happened or is true’. If we fill in that A
stands for a hypothesis of interest and B for data we
collected, then P(A given B) represents the probability
of our hypothesis given the data we observed in our
study.
(to get P(A|B), we need P(A); the prior probability of the hypothesis)
A frequentist interval is called a confidence interval. A Bayesian interval is called a credible interval
with confidence interval: "If we were to repeat this experiment many times and calculate an
interval each time, 95% of the intervals will include the true parameter value (and 5% does not)"
with credible interval: "There is 95% probability that the true value is in the interval."
P-value (frequentist): the probability of observing the same or more extreme data given that the null
hypothesis is true.
A Bayesian probability also gives information about how likely a hypothesis is, given the observed
data. They measure a relative support, using the Bayes Factor.
(e.g. A BF12 of 10 means that the support for H1 is 10 time stronger than the support for H2)
A BF is not a probability but BFs can be transformed into (relative) probabilities.
First we have to define prior model probabilities: i.e., how likely is each hypothesis before seeing the
data. You could consider all hypothesis chanced equally, so H1=H2=0,5 or H1=H2=H3=0,33 (the
probabilities add up to 1 (also when the chances are not equal)). Adding up to 1 applies to prior
probabilities and posterior model probabilities (PMP)
(when BF12=3, chances of H1=0,75 and H2=0,25)
,Assumptions about MLR (multiple linear regression):
About the measurement level of variables in MLR:
The dependent variable is a continuous measure (Interval or Ratio)
The independent variables are continuous or dichotomous (nominal with two categories)
About linearity of relations:
There is linear relationships between the dependent variable and each of the continuous
independent variables. (This can be checked using scatterplots, with the (continuous)
predictor on the x-axis and the outcome on the Y. The shape has to be oval (not S or curved)
to meet this assumption, then the relationship can best be described with a straight line)
Other:
No outliers (a case that deviates strongly from other cases in the data set, which can be on
variable, or multiple)
When you haven’t got a linear relationship, you can additional terms to the regression model, to
accommodate the non-linearity. If the shape is for example a curve, the quadratic relation may be
better than the linear one, so you can add a new variable (the squared version of the original X and
you run the regressing with both variables (X and X 2). You get two parameters (B1 and B2) out of
this, where:
- B1: informs you about the steepness of the overall
slope (the linear trend in the curved relation). The p-
value when testing B1 informs you whether the linear
trend is zero (horizontal) or not (when p<.05)
- B2: informs you about how curved the relation is, it measures the change in slope with increasing X.
The p-value when testing B2 informs you whether the change in slope is significantly non-zero. It
basically tells you if the quadratic relation is a better model for your data than the linear relation.
If you have an outlier, sometimes you can change it (e.g. you made a typo), or delete it, or make it
less extreme (e.g. by doing mean+2*SD). But all in all, transparency is import
It is important to visualize your data, because the influence of a violated model assumption on the
results can be severe.
Anscombe Quartet: describes four data sets that have several equal statistical properties
We want to check various assumptions:
Absence of outliers (multivariate, so for combinations of all variables in the model)
determine with histogram or boxplot, when one variable and with scatterplot when 2
variables.
Multivariate (for all variables in the model), this can be assessed whilst performing the
analysis.
On the basis of the values of the Casewise diagnostics, Standard residuals and Cook’s
Distance, it is possible to assess whether there are outliers in the Y-space and XY-space,
respectively
With standardized residuals we check whether there are outliers in the Y-space. As a rule of
thumb, it can be assumed that the values must be between -3.3 and +3.3. Those smaller than
-3.3, or greater than +3.3, indicate potential outliers.
With Cook’s Distance it is possible to check whether there are outliers within the XY-space.
An outlier in the XY-space is an extreme combination of X (all X-variables) and Y scores.
, Cook’s distance indicates the overall influence of a respondent on the model. As a rule of
thumb, we maintain that values for Cook’s distance must be lower than 1. Values higher than
1 indicate influential respondents (influential cases).
When you have to make a choice about whether or not to remove an outlier, a number of things can
be helpful:
Does this participant belong to the group about which you want to make inferences?
o If not, do not include the participant in the analysis.
Is the extreme value of the participant theoretically possible?
o If not, do not include the participant in the analysis.
o If so, you could run the analysis with and without the participant and compare
results.
When changing the data, you have to do it for the good reasons (not p-hacking) and be transparent
about it. Transparency is also reached by preregistration
Absence of multicollinearity
Multicollinearity indicates whether the relationship between two or more independent
variables is too strong.
Association between predictors is not a problem for MLR, but very large association (r
above .8 /.9) is.
If you include overly related variables in your model, this has three consequences:
o The regression coefficients (B) are unreliable,
o It limits the magnitude of R (the correlation between Y and Ŷ),
o The importance of individual independent variables can hardly be determined, if at
all
Determining whether multicollinearity is an issue can be done on the basis of the statistics
Tolerance or VIF (Variance Inflation Factor). You can use the following rule of thumb:
o Values for the Tolerance smaller than .2 indicate a potential problem.
o Values for the Tolerance smaller than .1 indicate a problem.
o The variance inflation factor (VIF) is equal to 1/Tolerance. So for the VIF, values
greater than 10 indicate a problem.
When you run into multicollinearity, you have to remove the variables that cause the
problem (which are highly correlated) or combine variables in a scale (e.g. using factor
analysis)
Homoscedasticity
Homoscedasticity is that the
spread of the residuals must be
approximately the same across all
values for the predicted y. We
check this by plotting the
(standardized) residuals against
the (standardized) predicted
values. If the spread is equally
distributed for every predicted value (X-axis) there is approximately the same amount of
spread around the Y-axis), you have homoscedasticity, otherwise heteroscedasticity.
The benefits of buying summaries with Stuvia:
Guaranteed quality through customer reviews
Stuvia customers have reviewed more than 700,000 summaries. This how you know that you are buying the best documents.
Quick and easy check-out
You can quickly pay through credit card or Stuvia-credit for the summaries. There is no membership needed.
Focus on what matters
Your fellow students write the study notes themselves, which is why the documents are always reliable and up-to-date. This ensures you quickly get to the core!
Frequently asked questions
What do I get when I buy this document?
You get a PDF, available immediately after your purchase. The purchased document is accessible anytime, anywhere and indefinitely through your profile.
Satisfaction guarantee: how does it work?
Our satisfaction guarantee ensures that you always find a study document that suits you well. You fill out a form, and our customer service team takes care of the rest.
Who am I buying these notes from?
Stuvia is a marketplace, so you are not buying this document from us, but from seller Samenvattingenvoorieder. Stuvia facilitates payment to the seller.
Will I be stuck with a subscription?
No, you only buy these notes for $8.57. You're not tied to anything after your purchase.