Summary Perception and Attention - Research Master - Maastricht University
105 views 4 purchases
Course
Perception & Attention (PSY4252)
Institution
Maastricht University (UM)
This document contains all papers and material needed for the 9 tasks, for both research and one-year master (they are the same). It is written in full sentences so everything can be understood. It contains all the figures that were important and discussed during the tutorials with Peter! I passed ...
Task 1: Retinotopy
Some terms:
Eccentricity: how far away you are from the foveal point, in degrees
Polar angle: angle that stimulus makes with the horizontal meridian
→ Early visual areas are retinotopically organized. They represent a quadrant of the
contralateral visual field, the upper or the lower, and represent two dimensions of the visual
field: 1) polar angle, 2) eccentricity. How does retinotopy work?
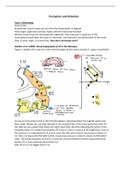
Gattass et al. (1981): Visual Topography of V2 in the Macaque
Figure 1: Border of V1 and V2 on the ventral surface of the cortex (central 5°, upper visual field)
On top you the ventral view of the left hemisphere, indicating where the sagittal section has
been made. Below, we now look laterally in the occipital lobe of the brain (posterior end). On
the right we see a graph that shows the right visual field, the dots indicating the center of the
receptive fields. It is visible than between RF 6 and 7, there is reverse in RF progression. Due to
this reverse, it is indicated that V1 and V2 share the VM, which forms the posterior border of
V2. Then, V2 shares the HM with further visual areas and so on. Only V1 shares its HM within
itself. The border between V1 and V2 is both the vertical meridian and the cytoarchitectural
border (V1 is more densely stained than V2).
Also, RFs in V2 are bigger than in V1.
,Figure 2: Border of V1 and V2 at the representation of the periphery (upper and lower VF)
In the top left we see the medial view of the left hemisphere, indicating where a coronal slice has been
made. So now we look inside the brain from the back, shown in the middle and right figure. The graphs
under the figure show corresponding receptive fields in the right visual field. Here we see the following:
RFs 1 to 6 go counterclockwise in the upper VF. Then, at RF 7, we see a reversal of receptive field
progression (border between V2 and V1). Now the direction goes clockwise, crossing the HM without
reversing directions, going towards the VM in the lower VF (V1). Then, at RF 20, the direction reverses
again (border to V2) and goes again counterclockwise, this time in the lower VF. At RF 26, it reverses
again, probably indicating a border to a higher visual area. All this can be seen in the section.
Figure 3: RF size as a function of eccentricity
In this figure we see a graph of the square root of field area
as a function of eccentricity. Here we see that the further
away the receptive fields are from the fovea, the bigger the
receptive fields become. V1 and V2 both start around the
same place (meaning that they have comparable receptive
field sizes around the fovea), but V2 will at all times be
about 3 times bigger than V1. This has to do with
convergence: V2 collects information from several V1 cells,
therefore the receptive fields of these V1 cells will be
combined to form the bigger V2 cell receptive field.
,Figure 4: Cortical magnification factor as a function of eccentricity and Convergence
In this figure we see a graph with magnification factor in
function of eccentricity. The overall magnification is bigger at
the fovea. In V2 this magnification is smaller compared to V1
as a result of convergence.
Convergence already takes place in the retina:
Fovea: retina one-to-one mapping
between photoreceptors and ganglion
cells, so more neurons are needed in
the brain, more space in the cortex
Periphery: pooled input of many
photoreceptors, less neurons are
needed, less cortical magnification
Figure 5: Overview of the findings
The horizontal meridian are the green lines, the vertical meridian the blue lines are. It is visible
that lower eccentricities are represented more laterally and higher eccentricities medially. Now
even though this figure looks quite nice, Peter doesn’t like this figure as all meridians come
together in one point, the fovea. This makes no sense from what we know from cortical
magnification: The fovea should take in much more space than just one tiny point.
, Therefore, the meridian lines should also be more parallel with each other in the brain. When
stretching apart the angles closer to the centre, that pushes the vertical meridian towards the
horizontal, resulting in cortical magnification for fovea compared to the periphery, as can also
be seen here below:
This schema is usually folded in the brain, so this
shows a flattened scheme of the cortex. When
now cutting along the middle of the calcarine
sulcus (HM of V1) from high eccentricity towards
low eccentricity, but you don’t cut the fovea, then
you get the following V shape:
This basically brings us to the figures of the
second paper and the figures from the task in the
course manual:
Sereno et al. (1995): Borders of Multiple Visual Areas in Humans Revealed by Functional
Magnetic Resonance Imaging
What they did:
→ semi-circular checkerboard stimulus: clockwise and
counterclockwise slowly rotated. In this way, BOLD for areas
representing superior quadrant will be activated at different
time than areas representing inferior quadrant, thereby
allowing them to track continuously the representation of
entire visual field. This checkerboard stimulus was used to map
polar angle onto the visual areas of the brain
→ thick ring: dilating and contracting. This helps us to compare
areas that respond to foveal stimulation and those that
respond to peripheral stimulation: This thick ring stimulus was
used to map eccentricity onto the visual areas of the brain
The benefits of buying summaries with Stuvia:
Guaranteed quality through customer reviews
Stuvia customers have reviewed more than 700,000 summaries. This how you know that you are buying the best documents.
Quick and easy check-out
You can quickly pay through credit card or Stuvia-credit for the summaries. There is no membership needed.
Focus on what matters
Your fellow students write the study notes themselves, which is why the documents are always reliable and up-to-date. This ensures you quickly get to the core!
Frequently asked questions
What do I get when I buy this document?
You get a PDF, available immediately after your purchase. The purchased document is accessible anytime, anywhere and indefinitely through your profile.
Satisfaction guarantee: how does it work?
Our satisfaction guarantee ensures that you always find a study document that suits you well. You fill out a form, and our customer service team takes care of the rest.
Who am I buying these notes from?
Stuvia is a marketplace, so you are not buying this document from us, but from seller fuzzyface. Stuvia facilitates payment to the seller.
Will I be stuck with a subscription?
No, you only buy these notes for $7.59. You're not tied to anything after your purchase.