2022 NEW EXAM ACT SCIENCE ALL DONE SOLUTION STUDY GUIDE
18 views 0 purchase
Course
2022 ACT SCIENCE
Institution
2022 ACT SCIENCE
Name the three question types and their percentage - Data representation 35% research
summaries 50% conflicting viewpoints 15%
What does data rep have you do three things - 1read graps
2interpret Scatter Plots questions about grafs
3explained information
What do you do on Research summaries ...
2022 new exam act science all done solution study guide
name the three question types and their percentage
what does data rep have you do three things
what do you do on research summaries
Written for
2022 ACT SCIENCE
All documents for this subject (1)
Seller
Follow
BrainEdge
Reviews received
Content preview
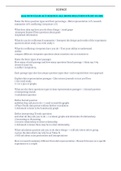
SCIENCE
2022 NEW EXAM ACT SCIENCE ALL DONE SOLUTION STUDY GUIDE
Name the three question types and their percentage - Data representation 35% research
summaries 50% conflicting viewpoints 15%
What does data rep have you do three things - 1read graps
2interpret Scatter Plots questions about grafs
3explained information
What do you do on Research summaries - Interpret the design and results of the experiment
questions about study ones 32in study 3
What do conflicting viewpoints have you do - Test your ability to understand
outline
compare different viewpoints questions about scientists one in scientists to
Name the three types of act passages
How many of each passage and how many questions Ineach passage - 3data rep 5-6q
3reserch sum5-6q
1conflict viewpiont7q
Each passage type also has unique question types that - each required their own approach
Explain data representation passages - Like science journals in text you'll see
1 the word study
2 1 to 4 pics or graphs
What are the three questions types in data representation passages - 1 factual question
2 interpreting trends
3 calculation question
Define factual question
andwhat they ask you to do - 1 need to read the graphs
2 Place Pacific data points without further couculation
3 Advanced version is the Luminosity graph
Define interpreting Trends questions
and what do they ask you to do - 1 evaluate graphs and determine if relationshiop
2 increasing or decreasing
3 inverse relationship or direct relationship
4 Advanced versions there may be no clear relationship
What calculation question ask you to do three things - 1 will ask where info is going
2 given the data what's my why be at Value X
3 will ask about extra possessions and interpretations
How is research summary different from data representation - Research focuses on a specific
experiment or a couple
, What are the 3 types of questions from research summary questions - 1 experimental design/
research intent question
2 hypothetical experiment
3 interpreting experiment
What do experimental design questions asked you to do - 1 why research designed experiment
a certain way
2 what are the controls and variables
3 what is hypothesis
what do hypothetical experiment questions asked you to do two things - 1 determine what
would happen if there was a change in experiment example temperature solution
2 need to understand the trend of data to predict how the outcome would change if the
experiment were changed
What do interpreting experiment questions asked you to do
2 - 1 interpret info as given
22x2matrix q of yes cuz a
yes cuz b
no cuz a
no cuz b
Strategy for data representation and research summaries one thing - Go straight to the
question without reading the passage
Strategy for data representation in research summaries questions that you can't answer with
visuals - Circle and come back later
Data representation in research summaries after you answer all the questions you can do what
with the visual questions - Skim the passage for keywords and answer the remaining questions
Name the two types of passages of conflicting viewpoint - 1 understanding of viewpoints
2 comparing of viewpoints
What does understanding viewpoints have you do
2 - 1 check to see if you understand each author's point of view
2 what would researcher X predict to happen
What are the two reading skills science tests - 1 reading visuals for scientific data
2skiming
Explain reading visuals two things - 1 list questions can be answered just by reading graphs
2 ignore all info graph questions doesn't ask about
Explain skinning - Look for keywords in answer questions when you tried visuals and you're
stuck
The benefits of buying summaries with Stuvia:
Guaranteed quality through customer reviews
Stuvia customers have reviewed more than 700,000 summaries. This how you know that you are buying the best documents.
Quick and easy check-out
You can quickly pay through credit card or Stuvia-credit for the summaries. There is no membership needed.
Focus on what matters
Your fellow students write the study notes themselves, which is why the documents are always reliable and up-to-date. This ensures you quickly get to the core!
Frequently asked questions
What do I get when I buy this document?
You get a PDF, available immediately after your purchase. The purchased document is accessible anytime, anywhere and indefinitely through your profile.
Satisfaction guarantee: how does it work?
Our satisfaction guarantee ensures that you always find a study document that suits you well. You fill out a form, and our customer service team takes care of the rest.
Who am I buying these notes from?
Stuvia is a marketplace, so you are not buying this document from us, but from seller BrainEdge. Stuvia facilitates payment to the seller.
Will I be stuck with a subscription?
No, you only buy these notes for $8.99. You're not tied to anything after your purchase.