This summary shows the main topics of this course. This is part of the exam simulation. This summary contains chapter 5 and chapter 8 of the book operations management 12th edition. There is also chapter 5 of the book Russell which deals with Waiting line theories.
waiting line theories singele and multiple server model
Written for
Hogeschool Windesheim (HW)
Technische Bedrijfskunde
Operations Management
All documents for this subject (23)
Seller
Follow
lieker
Content preview
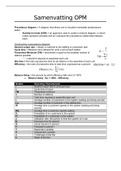
Samenvatting OPM
Precedence diagram = A diagram that allows one to visualize immediate predecessors
better
- Activity-on-node (AON) = an approach used to create a network diagram, in which
nodes represent activities and arc represent the precedence relationship between
them.
Constructing a precedence diagram:
Desired output rate = Ideally is matched to the staffing or production plan
Cycle time = Maximum time allowed for work a unit at each station
Theoretical Minimum (TM) = benchmark or goal for the smallest number of
stations possible
- = total time required to assemble each unit
Idle time = the total unproductive time for all stations in the assembly of each unit
Efficiency = the ratio of productive time to total time, expressed as a percent
Balance Delay = the amount by which efficiency falls short of 100%
o Balance Delay (%) = 100% - Efficiency
Notatie Operating Characteristic
r Desired output rate in units per hour
c Cycle time in hours
TM Theoretical minimum
n Number of stations
Total time required to assemble each unit
L Average number of customers in the system (waiting and being served)
Lq Average number of customer in the waiting line
W Average time a customer spends in the system (waiting and being
served)
Wq Average time a customer spends waiting
P0 Probability of no customers in the system
Pn Probability of n customers in the system
ρ Utilization rate; the portion of time the system is in use
Et Forecast error for period t
Dt Actual demand in period t
Ft Forecast for period t
Y Dependent variable
X Independent variable
a Y-intercept of the line
b Slope of the line
The benefits of buying summaries with Stuvia:
Guaranteed quality through customer reviews
Stuvia customers have reviewed more than 700,000 summaries. This how you know that you are buying the best documents.
Quick and easy check-out
You can quickly pay through credit card or Stuvia-credit for the summaries. There is no membership needed.
Focus on what matters
Your fellow students write the study notes themselves, which is why the documents are always reliable and up-to-date. This ensures you quickly get to the core!
Frequently asked questions
What do I get when I buy this document?
You get a PDF, available immediately after your purchase. The purchased document is accessible anytime, anywhere and indefinitely through your profile.
Satisfaction guarantee: how does it work?
Our satisfaction guarantee ensures that you always find a study document that suits you well. You fill out a form, and our customer service team takes care of the rest.
Who am I buying these notes from?
Stuvia is a marketplace, so you are not buying this document from us, but from seller lieker. Stuvia facilitates payment to the seller.
Will I be stuck with a subscription?
No, you only buy these notes for $4.30. You're not tied to anything after your purchase.