Fish health & growth
Define and distinguish growth, (relative) growth rate and explain the underlying processes
(hyperplasia and hypertrophy)
Explain the basis of allometry in relation to seasonality and development of the animal
Explain the relation between the Von Bertalanffy, Logistic and Exponential Growth equations
and why one is preferred above the other
Outline the different growth models and calculate how feeding levels can be estimated using
the B-E model
Explain the relevance of fish health and the impact of (potential) fish diseases with respect to
the aquatic industry
Reproduce the steps of the necropsy procedure and reason why the procedure is formulated
as such
Summary
Fisheries want to capture in a sustainable way the maximum number of fish of a desired class. They
can influence the numbers and size distribution of the wild population, but not the growth rate of
individual fish. Aquaculture is geared towards the realization of a maximum biomass of fish within a
certain time. Growth rate is dependent on internal and external factors. The growth should be
obtained in a positive economical way (in commercial fish operations). Factors that influence this are
feed conversion, growth rate, survival and quality of end products.
Growth of fish is often expressed in length, because wild fish are hard to weigh and fish length is an
important characteristic for selective gear. Different measurement methods exist:
- Total length (TL): snout to tip of longest caudal fin
- Fork length (FL): snout to end of middle caudal fin rays
- Standard length (SL): snout to end op hyperal bone/ beginning of tail
SL is most often used, because of possible fin damage. For aquaculture practises, length is less
appropriate, because it doesn’t directly correlate with weight. Actual weight depends on husbandry
conditions, feeding methods, fish health status etc.
Growth can be studied using metabolic relations. Growth functions can be divided into three groups:
1) empirical growth functions, 2) bio-energetic growth model, 3) biochemical approach (not
discussed further).
When fish have access to all the feed they want, their growth function has a sigmoid curve. In the
first part of their life growth happens at the fastest rate, until the inflection point, afterwards growth
decreases with time until the growth rate is 0 (body mass remains constant). Nutrient, environment
and some fish related factors affecting growth are not constant, causing fluctuations in growth
(weekly, monthly, yearly). Compensatory growth can occur due to these fluctuations. After a period
of retarded growth, accelerated (compensatory) growth occurs, which is often achieved via
hyperphagia, but sometimes also improved digestibility or a reduced maintenance requirement. Fish
that live in a habitat where feed is accessible all year round show low capacity for compensatory
growth.
The growth curve of crustaceans (crabs, shrimp, lobsters) do not follow a smooth curve, due to their
exoskeleton. In order to grow, they have to come out of their exoskeleton and form a new one. This
process is called moulting and is done by loosening the connectives between them and their
,exoskeleton, whereafter they escape it, fill themselves up with water to expand the new, still flexible
skeleton. Finally the exoskeleton hardens with help of proteins and minerals. In between moults,
water is replaced by tissue. At moulting, the dry matter content decreases and in between moults it
increases.
General growth description
Rates of growth are more informative than size itself. The growth rate can be obtained by
differentiating the growth curve over time. Since growth and growth rate are both dependent upon
fish size, often the relative growth is used (growth rate divided by size). The relative growth rate
decreases with time, as the size of the fish increases.
The principal of exponential growth is that the growth rate at time point (t) is a constant fraction.
Consequently, the relative growth rate is constant over time. The relative growth rate in exponential
approach is called the specific growth rate (SGR). It is mostly expressed as a percentage of the mean
body weight per day. The validity of the exponential growth model is only limited to a small time
interval, but still SGR is most commonly used to express growth.
Another disadvantage of the exponential growth model is that the underlying mechanisms involved
with growth, like energy requirements for maintenance and maximal feed intake, are not
proportional to body weight. Consequently, when expressing growth rate with SGR, this will still be
dependent upon the actual size of the fish. Young fish may have a maximal SGR of up to 10%/BW/d,
whereas in adult fish this will be lower than 1.5%/BW/d. Comparisons of relative growth rates within
and between species is biased if there are differences in body weights.
The concept of metabolic weight is used to have an expression for maintenance requirement/energy
metabolism, which is not size dependent.
Maintenance= a * Wb
Wb represents metabolic body weight, b= 0.75 for homeothermic animals and 0.8 for fish
Bio-energetic growth model
Growth is the result of conversion of food material into body tissue. This relationship of partitioning
of food into bodily material can be quantified and clarified by material balances (nitrogen,
phosphorus, carbon) and energy balances.
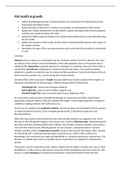
Energy balances can be calculated according to the following figure, where Faecal loss stands for
energy losses through faeces, excretion losses (branchial and urinary losses) stands for losses
through branchia and urine, and heat stands for energy losses through heat production
(maintenance or production).
,For making a complete energy balance one has to measure the amount of energy consumed (GE) and
all types of energy losses, which is done in bio-energetic studies. Total heat production can be
measured through respiration measurements. The bio-energetic growth model is also defined as the
energy budget. There are two known energy budgets:
- Carnivorous fish: 100 GE= 29 ER + 44 H + 7 BUE + 20 FE
- Herbivorous fish: 100 GE= 20 ER + 37 H + 2 BUE + 41 FE
The amount of BUE is higher in carnivorous fish due to a higher amount of protein in the diet. The
assimilation efficiency is lower for herbivorous fish, because of a high FE (hard to digest diet).
Bio-energetic research is also very valuable for estimating the growth potential of fish in relation to
both external and internal factors. The difference between the maximum heat production and the
maintenance heat production gives the metabolic scope for growth. It serves as a parameter for the
growth capacity of the fish. Hmax and Hm can be measured in relation to different factors, such as
temperature and size of fishes.
If you follow the bio-energetic growth model growth can be affected by:
- The voluntary feed intake
- The digestibility of consumed nutrients
- The losses through excreta
- The maintenance requirements
- The composition of growth (fat to protein ratio)
Under ad libitum feeding conditions, the biggest effect of unfavourable environmental conditions is
reduced voluntarily feed intake. Part of the effects could also be due to e.g. an increased
maintenance requirement. Ad libitum feeding however has the risk of overfeeding in fish.
Overfeeding leads to feed wastes, which have a negative effect on water quality:
1. It increases the amount of suspended solids, which can accumulate in fish gills and hamper
oxygen uptake
2. Feed waste is substrate for microbes in the water, stimulating their growth and reducing
dissolved oxygen content of the water (oxygen used by microbes)
The feed ration at which growth is maximal is the maximum ration (Rmax). The feed ration at which
conversion efficiency is maximal is the optimal ration (Ropt). The feed ration at which growth is 0 is
the maintenance ration (Rm). The maintenance requires can be up to 10 times larger in
homeothermic animals, thus the maximal feeding ration is also larger. The shape of the
growth/ration curve is the same regardless of the dimensions. However, from the definition of
maintenance it follows that Rm differs for growth expressed on weight basis and on energy basis.
This is due to the fact that animals have a higher priority for protein gain than for fat gain at low
feeding rations.
Because fish are poikilothermic, fast and large temperature changes result in thermal shock, which
might kill the fish. Water temperature also has an impact on other environmental parameters, by
which it can indirectly influence growth. Water temperature influences happen by impacting
voluntary feed intake and by impacting energy requirements for maintenance.
Heat production of fish is directly related to oxygen production. The oxygen consumption rates of
well-fed fish are higher than those of starving fish, because oxygen is needed for capturing and
digesting food. When the amount of DO is low, feed intake is reduced.
, We have discussed different external factors that influence growth. Factors can be categorized on
the way they influence growth.
1. Factors which are required for growth but not harmful. Examples are nutritional factors and
water oxygen content. When these factors are increased growth also increase, up to an
inflection point where more increase of the factor does not result in an even higher growth
rate.
2. Factors which can be harmful for fish when exceeding a threshold value, such as NH4+ and
NO3 concentrations in water.
3. Factors, which are characterized by having an optimal value for growth, such as pH and
temperature.
The relationship between feed ration and growth can be affected by other factors than feeding level:
1. By affecting the maximum growth rate in the area where the factor feeding ration does not
determine growth rate. An example is increasing the water oxygen content, so that the
capacity for maximum feeding ration is increased.
2. By affecting the slope of the relationship, which can be done by improving the quality of the
diet and thus conversion efficiency.
3. By shifting the complete curve to the left or right along the x-axis, so that the maximum
growth rate can be achieved at lower feeding rations (depends on maintenance
requirements).
Fish health
Fish diseases occur naturally in the wild, but their effects often go unnoticed because dead fish
quickly become prey. Disease events occur more easily in farmed fish because fish are reared at a
higher density, increasing contamination rate and infected fish are not removed as quickly as they
would be by natural predators. Measures have been developed to effectively control bacterial
diseases in farmed fish, such as vaccines, probiotics, limiting culture density, high quality diets and
sometimes antibiotics. Successful measures to control parasites include therapeutants, fallowing
farm sites and pest management strategies. Most countries have animal health regulations regarding
transport and managing diseases.
Teleost anatomy
The skin consists of an epidermis, dermis and hypodermis. The epidermis consists of an outer layer
of cells that form a stratified epithelium and a deeper layer of undifferentiated cells, called the basal
germinative layer. This layer is adjacent to an acellular basal lamina or basement membrane, which
separates the epidermis from the dermis. In some teleosts the skin of certain parts of the body has
keratinized structures. However, this is not typical, because fish do not need to protect themselves
against dehydration. The epidermis contains mucus secreting cells, chemosensory cells and
The benefits of buying summaries with Stuvia:
Guaranteed quality through customer reviews
Stuvia customers have reviewed more than 700,000 summaries. This how you know that you are buying the best documents.
Quick and easy check-out
You can quickly pay through credit card or Stuvia-credit for the summaries. There is no membership needed.
Focus on what matters
Your fellow students write the study notes themselves, which is why the documents are always reliable and up-to-date. This ensures you quickly get to the core!
Frequently asked questions
What do I get when I buy this document?
You get a PDF, available immediately after your purchase. The purchased document is accessible anytime, anywhere and indefinitely through your profile.
Satisfaction guarantee: how does it work?
Our satisfaction guarantee ensures that you always find a study document that suits you well. You fill out a form, and our customer service team takes care of the rest.
Who am I buying these notes from?
Stuvia is a marketplace, so you are not buying this document from us, but from seller jasmijnrenger. Stuvia facilitates payment to the seller.
Will I be stuck with a subscription?
No, you only buy these notes for $6.32. You're not tied to anything after your purchase.