Everything needed to get top grades in the AQA AS-Level Economics exams:
-All core topics and theories
-Graphs and economic diagrams- as well as how to read them
-Key words and definitions
-Exam practice and technique
1.3.1 What is the nature of economics?
Scarcity is the fundamental problem of having unlimited wants and yet limited resources.
In the world there exists a problem. As a country there exists an unlimited quantity of wants but a limited quantity of
resources. Unlimited wants cannot be satisfied, so decisions have to be made about what to produce, how best to produce
this, and for whom to produce.
We all face these problems: as consumers we decide what to buy, producers decide what to produce, and governments
decide how to ration resources.
Economics is the study of how humans act and make decisions under conditions of scarcity.
Renewable (sustainable) resources are resources that can be replenished when used up. An example is water.
Non-renewable resources are resources that cannot be replenished like oil.
Opportunity cost – scarcity leads to choices. We must make choices – and we can look at what we miss out on when we make
a choice. The opportunity cost is The cost of passing up the next best choice when making a decision.
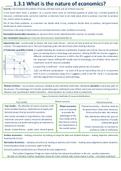
A Production possibility frontier is a graph depicting the maximum combination of goods and services that can be produced
given an existing level or technology and resources. Moving ALONG the frontier suggests a
different combination of resources. A shift in the PPF suggests at all levels the combination
has improved. Factors shifting PPF include level of technology, size of labour force, level of
investment, stock of resources available.
X is a point that is inefficient – more could be made without less of another.
A,B,C are efficient combinations – no more of B can be had without less of A. A movement
from A to B is a movement along. B to Y suggests a shift in the PPF. Point Y is not possible
with the original level of resources and technology.
Division of labour – occurs when a process is divided up into individual small tasks. Individuals specialise in particular parts of
the process. The advantages of it include: productivity gains; individuals more skilled; saves time and money training workers.
However over specialisation leads to boredom – demoralisation can create a drop in productivity.
Types of economy (methods of resource distribution)
Free market Mixed economy Planned economy
Free market – the allocation of scarce resources is left Mixed economies Planned economies – decisions made by
to the invisible hand e.g. market forces of supply and exist in an attempt the government. State owns resources.
demand answer the key economic questions. to provide the Prices set by the state. No markets.
Adv include: provided no imperfections, free market advantages of the Adv: distribution will be fair; gov can
maximises consumer surplus; resources allocated by free market and to remove production of socially
market forces; the profit motive gives an incentive for intervene to remove undesirable goods
producers to innovate the imperfections of
Disadv: bureaucratic; no incentive to
the market system.
Disadv: market failures – public, merit, demerit goods, producers; leads to inefficiency
Positive Economics – studying economics by looking at empirical data and testable theories – making objective statements
based purely on fact
Normative Economics – studying economics by looking at opinions and morals – making value judgements about situations.
Theorising about what an economy ought to be like.
Economic policies and decisions are influenced by value judgements.
The London Congestion Charge on motor vehicles has reduced air pollution in the city – positive statement
The plan to introduce a higher congestion charge for motor vehicles with a large engine is unfair – normative statement
, 1.3.2 What determines the demand for a good?
Demand – the desire, willingness and ability of consumers to buy a given good/service
An individual demand curve shows the relationship between the amount that someone is
willing to buy at a given price (Ceteris Paribus).
http://1.bp.blogspot.com/_4cclfrmzWyk/Rzb9fdNrG-
As shown right, a change in price and ONLY PRICE causes a movement along the demand
I/AAAAAAAAAaY/hf6k_TB64JM/s320/inelastic+demand+curve.gif
curve. A movement down the demand curve is called an extension, and movement up is
called a contraction.
The law of demand – ceteris paribus, a higher quantity of a normal good will be demanded at a lower price.
Demand is downward sloping because of the law of diminishing marginal utility (as quantity increases, your extra utility
gained from having more decreases so you will pay less) and:
1. Income effect – as price rises, it takes up more of your income so naturally you demand less
2. Substitution effect - as price rises, other goods are relatively cheaper –this good is demanded less
A market demand curve is a summation of all individual demand curves showing the total demand for a
good at given prices in an economy.
1. Ostentatious goods – goods that people want to be seen having – have an upward sloping demand
Curve. E.g. wine
2. Joint demand – when goods are demand together
3. Composite demand – when a good is demanded for two or more uses
4. Derived demand – when the demand for something occurs as a result of the demand for something else. Labour is demanded because the
product produced by labour is demanded.
5. Inferior good – a good for which demand falls as incomes rise. Consumers switch to more luxurious alternatives.
Changes in autonomous factors (not price) lead to a shift in demand, shown right.
P – Population. As the population grows, demand for goods rises
I – Incomes – assuming normal goods, as income rises, demand for goods rises
R – Related goods 1. goods bought together (complements)- as price of complement falls,
demand rises.
2. goods that are substitutes – as price of substitute rises, demand rises
A – Advertising – a successful advertising campaign for a good raises demand
T - Tastes and fashions – when goods are considered fashionable, demand rises
E – Expected price changes – if a good is expected to rise in price, more is bought now.
When demand increases, more is demanded at each and every price.
Elasticity of demand – measures the responsiveness of demand to a change in another variable. For a normal good, as price rises, demand
falls. But by how much? This is what PED measures.
If demand is price elastic, then a change in price leads to a more than proportionate change in quantity demanded.
If demand is price inelastic, then a change in price leads to a less than proportionate change in quantity demanded.
If demand is unit elastic, then a change in price leads to the same change in quantity demanded.
PED = 1/gradient of demand curve = . %Δ= Sign of PED will be –ve for normal good.
1. The number of substitutes – more substitutes, demand more price elastic Inelastic demand
2. Time – in short run demand is more price inelastic as you have no alternatives Not responsive to change in price
3. Percentage of income spent on good – more % of income, more price elastic
4. Habit forming goods – habit forming goods are price inelastic
5. Brand loyalty – If there exists a great amount of brand loyalty, demand is price inelastic
6. Necessity – More necessary, more inelastic
If demand is price inelastic, a rise in price leads to a rise in revenue . If demand is price elastic, a fall in price raises revenue.
X(cross)ED = responsiveness of demand of good A to a change in price of good B. Shows the relationship between two goods.
Two substitute goods have positive XED. Two complement goods have negative XED.
Y(income)ED = responsiveness of demand for a given good to a change in income.
A normal good has positive YED but negative PED. An inferior good has negative YED and PED.
PED is important to show firms how to price and to show governments what to tax / subsidise
YED is important to Governments because they set income tax. YED is important to firms – when incomes rise, inferior goods are demanded less
XED is important because firms can see how other firm’s price changes will affect the demand for their good.
, 1.3.3 What determines the supply of a good?
Supply – the desire, willingness and ability of producers to sell a given good/service
An individual supply curve shows the relationship for a given good between the amount that
someone is willing to sell at various prices (Ceteris Paribus).
As shown right, a change in price and ONLY PRICE causes a movement along the supply
curve. A movement down the supply curve is called a contraction, and movement up is
called an extension.
The law of supply – ceteris paribus, a higher quantity of a normal good will be supplied at a
higher price.
Supply is upward sloping because of the profit motive and because of the marginal cost curve.
The marginal cost curve shows that as quantity increases, a higher cost is incurred. Hence a higher price is needed to supply the good.
A market supply curve is a summation of all individual supply curves showing the total supply of a good at given prices in an economy.
Changes in autonomous factors (not price) lead to a shift in supply, shown right.
C – Costs of production. The more expensive the raw resources, the less willing people are to supply
R – Related goods – goods in joint supply for example
E – Expected price changes. If price is likely to fall, more will supply now.
W – Weather. In a good summer farmers can supply more
S – Subsidies and taxes. Subsidies on goods make it more attractive to supply a good, and vice versa with tax.
T – Technology. If technology for production increases, it will be cheaper to produce a good therefore
more attractive to supply.
When supply increases, more is supplied at each and every price.
Elasticity of supply – measures the responsiveness of supply to a change in another variable. For a good, as price rises, supply
rises. But by how much? This is what PED measures.
If supply is price elastic, then a change in price leads to a more than proportionate
change in quantity supplied.
If supply is price inelastic, then a change in price leads to a less than proportionate
change in quantity supplied.
If supply is unit elastic, then a change in price leads to the same change in quantity supply.
PED . %Δ=
PES is not the inverse gradient. If the supply curve crosses the y axis before x, supply is elastic.
If the graph crosses the x axis before y, supply is inelastic. If the supply curve goes through the origin,
Supply is unit elastic.
1. Number of producers – The more producers the easier the industry can respond to price changes
2. Spare/excess capacity – A producer who has unused capacity can respond easily to price changes
3. Factor mobility – The easier it is to move resources into the industry the more elastic supply is.
4. Length of production period – The longer it takes to produce a good, the more inelastic supply is.
In the immediate run (all factors fixed) – supply is totally elastic – no matter what price the producer can only produce a certain quantity
In the short run (at least one factor is fixed) supply is inelastic – supply can respond to a change in price but the producer is still restrained by fixed factors
In the long run all factors are variable, the producer can respond at will to changes in price – supply is elastic.
The time taken to move from short run to long run depends on the industry. A nuclear power plant takes years to build more plants. A market stall will
take days.
The benefits of buying summaries with Stuvia:
Guaranteed quality through customer reviews
Stuvia customers have reviewed more than 700,000 summaries. This how you know that you are buying the best documents.
Quick and easy check-out
You can quickly pay through credit card or Stuvia-credit for the summaries. There is no membership needed.
Focus on what matters
Your fellow students write the study notes themselves, which is why the documents are always reliable and up-to-date. This ensures you quickly get to the core!
Frequently asked questions
What do I get when I buy this document?
You get a PDF, available immediately after your purchase. The purchased document is accessible anytime, anywhere and indefinitely through your profile.
Satisfaction guarantee: how does it work?
Our satisfaction guarantee ensures that you always find a study document that suits you well. You fill out a form, and our customer service team takes care of the rest.
Who am I buying these notes from?
Stuvia is a marketplace, so you are not buying this document from us, but from seller MBlake247. Stuvia facilitates payment to the seller.
Will I be stuck with a subscription?
No, you only buy these notes for $8.26. You're not tied to anything after your purchase.