Don’t forget watching the videos!
Statistical concepts to be discussed: central limit theorem, confidence interval
Problem 1
According to the central office of statistics (Dutch: CBS), the average length of all Dutch men
in the previous century was equal to μ = 172 cm and standard deviation equal to
σ =10 cm.
Fill in the question marks:
a. The corresponding sampling distribution of the sample average of a random sample of
size n is approximately normally distributed with an average value equal to?
The average value is equal to172 cm according to the central limit theorem. The
sample average which is normally distributed is equal to the population average
according to the central limit theorem.
b. When is the sampling distribution exactly normally distributed?
According to the central limit theorem, the sampling distribution theorem is exactly
normally distributed if (n) is infinitive or when the population distribution is normally
distributed.
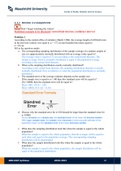
c. The standard error of the average estimate depends on the sample size.
If the sample size is equal to n= 100 then this standard error will be equal to?
If n=10000, then the standard error will be equal to?
SE(n=100): 10/10 = 1,00
SE(n=1000): 10/31.6) = 0.316
d. Discuss why the standard error for n=100 should be larger than the standard error for
n=10000.
As you increase your sample size, the standard error of the mean will become smaller.
With bigger sample sizes, the sample mean becomes a more accurate estimate of the
parametric mean, so the standard error of the mean becomes smaller.
e. What does the sampling distribution look like when the sample is equal to the whole
population?
When the sample is equal to the whole population, then all averages will be equal to
each other and equal to the population average. The corresponding sampling
distribution will be degenerated.
f. What does the sample distribution look like when the sample is equal to the whole
population?
When the sample is equal to the whole population, the sample distribution will be
equal to the population distribution.
BBS1003 Syllabus 2020-2021 202020
, Faculty of Health, Medicine and Life Sciences
g. What does the sampling distribution look like when the sample size is equal
n = 1?
The average of one observation is equal to the value of that observation. This means
that the sampling distribution is equal to the population distribution.
h. Suppose that you take a random sample of 5 people from the population of Dutch men
and calculate their average height, what can you say about the average height that you
will observe?
The average height which will be observed in the sample will deviate a lot from the
population average since n=small so inaccurate.
i. What if you took a sample of 10000?
The average height which will be observed in the sample will be close to the
population average since n=bigger so more accurate.
In research practice, we deal with the reverse situation: we know the sample, but not the
population.
j. Explain in your own words why usually we have a reverse situation by means of an
example?
The sample is a small group of people which is way easier to examine than a whole
population. In research practice, the sample is also exposed or affected by something
like a disease for example. If you take a sample of people who account for the whole
population and you want to examine how many of them have a certain disease, the
sample will be known and the population hence unknown.
k. Suppose that you have collected just recently a random sample of size n=100 from the
population of all Dutch men and that you found an average height,
say X = 179 cm and suppose that it is known that the standard deviation is still equal
to σ =10 cm. Calculate the 95% confidence interval. What does this interval mean
(take as the 95% percentile point 1.96)
It is stated that the 95% percentile can be taken as 1.96. The boundaries are therefore 177,04-
180,96 (179-1.96/ 179+1.96). Strictly speaking a 95% confidence interval means that if we
were to take 100 different samples and compute a 95% confidence interval for each sample,
then approximately 95 of the 100 confidence intervals will contain the true mean value (μ).
95% of the intervals will cover the true population value μ. This represents the confidence
that the one you have constructed will cover the true population parameter. The true
population value will be captured by the 95% confidence interval with 95% confidence.
The 95% confidence interval can be used for all kinds of testing. For example:
l. The CBS has also published that the average length of men in this century increased to
μ = 180 cm on average compared to the average length of men in the previous century
(μ = 172 cm). Can you confirm this based on the sample that you just have collected
(see k.)?
μ = 172 cm This is not likely since the boundaries of the 95% confidence interval is
between 177,04 and 180,96. 172 falls below.
μ = 180 This is a likely outcome. The boundaries of the 95% confidence interval is between
177,04 and 180,96. 180 falls below.
BBS1003 Syllabus 2020-2021 212121
The benefits of buying summaries with Stuvia:
Guaranteed quality through customer reviews
Stuvia customers have reviewed more than 700,000 summaries. This how you know that you are buying the best documents.
Quick and easy check-out
You can quickly pay through credit card or Stuvia-credit for the summaries. There is no membership needed.
Focus on what matters
Your fellow students write the study notes themselves, which is why the documents are always reliable and up-to-date. This ensures you quickly get to the core!
Frequently asked questions
What do I get when I buy this document?
You get a PDF, available immediately after your purchase. The purchased document is accessible anytime, anywhere and indefinitely through your profile.
Satisfaction guarantee: how does it work?
Our satisfaction guarantee ensures that you always find a study document that suits you well. You fill out a form, and our customer service team takes care of the rest.
Who am I buying these notes from?
Stuvia is a marketplace, so you are not buying this document from us, but from seller summa2023. Stuvia facilitates payment to the seller.
Will I be stuck with a subscription?
No, you only buy these notes for $3.95. You're not tied to anything after your purchase.