Summary of most important points of book "Discovering statistics using IBM SPSS"
42 views 3 purchases
Course
Applied Business Research
Institution
Nyenrode Business Universiteit (Nyenrode)
Book
Discovering Statistics Using IBM SPSS
Dit is een samenvatting van het boek
"Discovering statistics using IBM SPSS" door Andy Field 5e editie .
Uitgever: Sage. ISBN 9521
Samenvatting bevat hoofdstukken van 1,2,6,8,9,10,11,12,14,18
De taal van deze samenvatting is Engels.
Exam Guide for Applied Multivariate Data Analysis – Get yourself a Wonderful Grade!
Summary of Statistics (IBC), Radboud University
Answers assignment 3 business research methods
All for this textbook (116)
Written for
Nyenrode Business Universiteit (Nyenrode)
Master Of Science In Controlling
Applied Business Research
All documents for this subject (3)
Seller
Follow
kolibrarium
Reviews received
Content preview
In-Confidence
Discovering statistics using IBM SPSS by A. Field, 5th ed
Discovering statistics using IBM SPSS
(Andy Field, 5th edition)
Contents
Chapter 1 Why to learn statistics ...........................................................................................................................2
Collecting data: measurement ............................................................................................................................2
Variables ..........................................................................................................................................................2
Levels of measurement ...................................................................................................................................2
Validity and reliability ......................................................................................................................................3
Analyzing data .....................................................................................................................................................3
Frequency distribution ....................................................................................................................................3
The mode, median & mean .............................................................................................................................4
The dispersion in a distribution .......................................................................................................................4
Z-value (or standardization) ............................................................................................................................5
Chapter 2 The SPINE of statistics ............................................................................................................................5
Chapter 6 The beast of bias ....................................................................................................................................6
Data transformation ............................................................................................................................................6
Chapter 8 Correlation .............................................................................................................................................7
Covariance ...........................................................................................................................................................7
Standardization and the correlation coefficient .................................................................................................7
Correlation ...........................................................................................................................................................8
Using R2 for interpretation ..................................................................................................................................8
Chapter 9 Regression (Linear model) .....................................................................................................................8
The linear model with several predictors ............................................................................................................8
Estimating the model ..........................................................................................................................................8
Assessing the goodness of fit, sums of squares, R and R2 ...................................................................................9
Cross-validation of the model .............................................................................................................................9
Correlation vs Regression ....................................................................................................................................9
Chapter 10 Comparing two means .........................................................................................................................9
The t-test .............................................................................................................................................................9
Chapter 11 Moderation, mediation and multicategory predictors ....................................................................10
Moderation: interactions in regression .............................................................................................................10
Moderation formula ..........................................................................................................................................10
Moderation in a nutshell ...................................................................................................................................11
Mediation ..........................................................................................................................................................11
Mediation in a nutshell......................................................................................................................................12
Chapter 12 Comparing several means: ANOVA ...................................................................................................12
Chapter 14 Factorial ANOVA ................................................................................................................................12
Chapter 18 Exploratory factor analysis ................................................................................................................13
When to use factor analysis ..............................................................................................................................13
1
, In-Confidence
Discovering statistics using IBM SPSS by A. Field, 5th ed
Chapter 1 Why to learn statistics
Collecting data: measurement
Variables
When doing research there are some important generic terms for variables that you will encounter:
Independent variable: A variable thought to be the cause of some effect. This term is usually used in
experimental research to denote a variable that the experimenter has manipulated.
Dependent variable: A variable thought to be affected by changes in an independent variable. You can
think of this variable as an outcome.
Predictor variable: A variable thought to predict an outcome variable. This is basically another term for
independent variable.
Outcome variable: A variable thought to change as a function of changes in a predictor variable. This
term could be synonymous with ‘dependent variable’ for the sake of an easy life.
Levels of measurement
Variables can be split into categorical and continuous, and within these types there are different levels of
measurement:
Categorical (entities are divided into distinct categories):
o Binary variable: There are only two categories (e.g., dead or alive).
o Nominal variable: There are more than
two categories (e.g., whether someone is
an omnivore, vegetarian, vegan, or
fruitarian).
o Ordinal variable: The same as a nominal
variable but the categories have a logical
order (e.g., whether people got a fail, a
pass, a merit or a distinction in their
exam).
Continuous (entities get a distinct score):
o Interval variable: Equal intervals on the variable represent equal differences in the property
being measured (e.g., the difference between 6 and 8 is equivalent to the difference between
13 and 15).
o Ratio variable: The same as an interval variable, but the ratios of scores on the scale must also
make sense (e.g., a score of 16 on an anxiety scale means that the person is, in reality, twice as
anxious as someone scoring 8).
Dummy variables: a way of recoding a categorical variable with more than two categories into a series of
variables all of which are dichotomous and can take on values of only 0 or 1. There are seven basic steps to
create such variables:
(1) count the number of groups you want to recode and subtract 1;
(2) create as many new variables as the value you calculated in step 1 (these are your dummy variables);
(3) choose one of your groups as a baseline (i.e., a group against which all other groups should be
compared, such as a control group);
(4) assign that baseline group values of 0 for all of your dummy variables;
(5) for your first dummy variable, assign the value 1 to the first group that you want to compare against
the baseline group (assign all other groups 0 for this variable);
(6) for the second dummy variable assign the value 1 to the second group that you want to compare
against the baseline group (assign all other groups 0 for this variable);
(7) repeat this process until you run out of dummy variables.
2
, In-Confidence
Discovering statistics using IBM SPSS by A. Field, 5th ed
Validity and reliability
Validity – is an instrument actually measures what it sets out to measure.
Reliability – is whether an instrument can be interpreted consistently across different situations.
Validity is a necessary but not sufficient condition of a measure. A second consideration is reliability, which is
the ability of the measure to produce the same results under the same conditions. To be valid the instrument
must first be reliable. The easiest way to assess reliability is to test the same group of people twice: a reliable
instrument will produce similar scores at both points in time.
Analyzing data
Frequency distribution
A frequency distribution, or histogram, which is a graph plotting
values of observations on the horizontal axis, with a bar showing
how many times each value occurred in the data set.
In an ideal world data would be distributed symmetrically around
the centre of all scores. As such, if we drew a vertical line through
the centre of the distribution then it should look the same on both
sides. This is known as a normal distribution and is characterized by
the bell-shaped curve.
There are two main ways in which a distribution can deviate from normal: (1) lack of symmetry (called skew)
and (1) pointyness (called kurtosis). Skewed distributions are not symmetrical and instead the most frequent
scores (the tall bars on the graph) are clustered at one end of the scale. So, the typical pattern is a cluster of
frequent scores at one end of the scale and the frequency of scores tailing off towards the other end of the
scale. A skewed distribution can be either positively skewed (the frequent scores are clustered at the lower
end and the tail points towards the higher or more positive scores) or negatively skewed (the frequent scores
are clustered at the higher end and the tail points towards the lower or more negative scores).
A distribution with positive kurtosis has many scores in the tails (a so-called heavy-tailed distribution) and is
pointy. This is known as a leptokurtic distribution. In contrast, a distribution with negative kurtosis is relatively
thin in the tails (has light tails) and tends to be flatter than normal. This distribution is called platykurtic.
3
, In-Confidence
Discovering statistics using IBM SPSS by A. Field, 5th ed
The mode, median & mean
Mean – the sum of all scores divided by the number of scores. The value of the mean can be heavily influenced
by extreme scores.
Median – is the middle score when the scores are placed in ascending order. It is not as influenced by
extreme scores as the mean.
Mode – is the score that occurs most frequently.
The mode is the score that occurs most frequently in the data set. This is easy to spot in a frequency
distribution because it will be the tallest bar. To calculate the mode, simply place the data in ascending order
(to make life easier), count how many times each score occurs, and the score that occurs the most is the
mode.
Another way to quantify the centre of a distribution is to look for the middle score when scores are ranked in
order of magnitude. This is called the median.
To calculate the median, we first arrange these scores into ascending order: 22, 40, 53, 57, 93, 98, 103, 108,
116, 121, 234. Next, we find the position of the middle score by counting the number of scores we have
collected (n), adding 1 to this value, and then dividing by 2. With 11 scores, this gives us (n + 1)/2 = (11 + 1)/2 =
12/2 = 6. Then, we find the score that is positioned at the location we have just calculated. This process works
very nicely when we have an odd number of scores (as in this example) but when we have an even number of
scores there won’t be a middle value.
The mean is the measure of central tendency that you are most likely to have heard of because it is simply the
average score and the media are full of average scores. To calculate the mean we simply add up all of the
scores and then divide by the total number of scores we have.
The dispersion in a distribution
Deviance (or error) – the difference between each score and the mean.
4
, In-Confidence
Discovering statistics using IBM SPSS by A. Field, 5th ed
Variance is the average distance of scores from the mean. It is the sum of squares
divided by the number of scores. Variance tells us about how widely dispersed
scores are around the mean.
Standard deviation is a square root of the variance. SD tells us how well the mean
represents the sample data. Large standard deviations relative to the mean suggest data
are widely spread around the mean, whereas the small standard deviations suggest data
are closely packed around the mean.
The range is the difference between the highest and lowest scores.
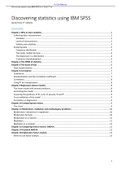
The variance and standard deviation tell us about the shape of the distribution of scores. If
the mean represents the data well then most of the scores will cluster close to the mean
and the resulting standard deviation is small relative to the mean. When the mean is a
worse representation of the data, the scores cluster more widely around the mean and the
standard deviation is larger. Figure 1.11 shows two distributions that have the same mean
(50) but different standard deviations. One has a large standard deviation relative to the mean (SD = 25) and
this results in a flatter distribution that is more spread out, whereas the other has a small standard deviation
relative to the mean (SD = 15)
resulting in a more pointy
distribution in which scores close to
the mean are very frequent but
scores further from the mean
become increasingly infrequent. The
main message is that as the standard
deviation gets larger, the distribution
gets fatter. This can make
distributions look platykurtic or
leptokurtic when, in fact, they are not.
Z-value (or standardization)
A frequency distribution can be either a table or a chart
that shows each possible score on a scale of
measurement along with the number of times that score
occurred in the data. These scores expressed in a
standard form and known as z-score.
The sign of the z-score tells us whetherthe original score
was aabove or below the mean; the value of the z-scoretells us how far the score was from the mean in
standard deviation units.
Chapter 2 The SPINE of statistics
Standard Error
Parameters
In statistics all comes down to a simple equation:
5
The benefits of buying summaries with Stuvia:
Guaranteed quality through customer reviews
Stuvia customers have reviewed more than 700,000 summaries. This how you know that you are buying the best documents.
Quick and easy check-out
You can quickly pay through credit card or Stuvia-credit for the summaries. There is no membership needed.
Focus on what matters
Your fellow students write the study notes themselves, which is why the documents are always reliable and up-to-date. This ensures you quickly get to the core!
Frequently asked questions
What do I get when I buy this document?
You get a PDF, available immediately after your purchase. The purchased document is accessible anytime, anywhere and indefinitely through your profile.
Satisfaction guarantee: how does it work?
Our satisfaction guarantee ensures that you always find a study document that suits you well. You fill out a form, and our customer service team takes care of the rest.
Who am I buying these notes from?
Stuvia is a marketplace, so you are not buying this document from us, but from seller kolibrarium. Stuvia facilitates payment to the seller.
Will I be stuck with a subscription?
No, you only buy these notes for $9.19. You're not tied to anything after your purchase.