Lurking variables - Study guides, Class notes & Summaries
Looking for the best study guides, study notes and summaries about Lurking variables? On this page you'll find 127 study documents about Lurking variables.
Page 3 out of 127 results
Sort by
-
AP Statistics Exam Cram Questions With Complete Solutions
- Exam (elaborations) • 7 pages • 2023
-
Available in package deal
-
- $10.99
- + learn more
Response Variables correct answer: variable of interest (y) Explanatory Variables correct answer: variable that explains y (x) Correlation Coefficent correct answer: measure strength of linear association Slope correct answer: b1= r(sy/sx) Y-Intercept correct answer: b0= ybar - (b1)(xbar) Point always on regression line correct answer: (xbar,ybar) R2 measures correct answer: fraction of variability of y accounted for by least squares linear regression on x Regression ...
-
AP Statistics Question and answers 2023/2024 verified to pass
- Exam (elaborations) • 8 pages • 2023
-
Available in package deal
-
- $13.99
- + learn more
AP Statistics Question and answers 2023/2024 verified to passStatistical Significance - correct answer An observed effect too large to attribute plausibly to chance. Non-Response Bias - correct answer Bias introduced to a sample when a large fraction of those sampled fails to respond. P-Value - correct answer found by substituting the x-value in the regression equation; they're the values on the fitted line Empirical Rule - correct answer A statistical rule stating that for a normal di...
-
C784 Statistics FULL COURSE REVIEW Questions and Answers 100% pass
- Exam (elaborations) • 7 pages • 2024
-
- $11.49
- + learn more
C784 Statistics FULL COURSE REVIEW Questions and Answers 100% pass Associated with the explanatory and the response variables that is not directly being studied. - Answer- Lurking Variable Occurs when a trend or result that appears in groups of data disappears when we combine the data. - Answer- Simpson's Paradox A process for estimating and analyzing the relationship between variables. - Answer- Regression Analysis AKA the line of best fit. y = mx + b "rise over run" - Answer- Leas...

-
Introduction to Statistics - final exam Questions and Correct Answers & Latest Updated
- Exam (elaborations) • 30 pages • 2024
- Available in package deal
-
- $13.49
- + learn more
average o :## - also called mean; a number that describes the central tendency of the data - a number that describes the central tendency of the data; there are a number of specialized averages, including the arithmetic mean, weighted mean, median, mode, and geometric mean. blinding o :## not telling participants which treatment a subject is receiving categorical variable o :## variables that take on values that are names or labels cluster sampling o :## a method for selecting a random...
-
AP Statistics Final Exam Questions Correctly Answered 2024.
- Exam (elaborations) • 8 pages • 2024
-
Available in package deal
-
- $10.49
- + learn more
AP Statistics Final Exam Questions Correctly Answered 2024. Statistical Significance - correct answer An observed effect too large to attribute plausibly to chance. Non-Response Bias - correct answer Bias introduced to a sample when a large fraction of those sampled fails to respond. P-Value - correct answer found by substituting the x-value in the regression equation; they're the values on the fitted line Empirical Rule - correct answer A statistical rule stating that for a normal di...
-
C784 Module 6: Correlation & Regression Questions Fully Solved Guaranteed Success.
- Exam (elaborations) • 14 pages • 2024
-
Available in package deal
-
- $12.99
- + learn more
lurking variable - correct answer A variable that is not included in an analysis but that is related to two (or more) other associated variables which were analyzed. simple linear regression - correct answer the prediction of one response variable's value from one explanatory variable's value Simpson's Paradox - correct answer A counterintuitive si...
-
Math 202 : Probability and Statistics Final Test Prep Questions With Complete Solutions
- Exam (elaborations) • 39 pages • 2023
- Available in package deal
-
- $13.99
- + learn more
Statistical Significance correct answer: When your discovered p-value is less than your alpha (.05 if not given). States that chance alone would rarely produce an equally extreme result. Non-Response Bias correct answer: A bias caused by a number of people who did not respond to the survey. p-Value correct answer: The probability of getting a result at least as extreme as the result given from the test. The lower the value the stronger the evidence. Empirical rule correct answer: St...
-
WGU C995 Exam Questions & Answers Accurate 100%
- Exam (elaborations) • 10 pages • 2024
- Available in package deal
-
- $12.49
- + learn more
quantitative data - Answer Quantitative data consists of data values that are numbers, representing quantities that can be counted or measured. The Empirical Rule - Answer According to The Empirical Rule, approximately 68% of the data points in a dataset will be within 1 standard deviation of the mean. 95% of all values are within 2 standard deviations of the mean. Normal distribution - Answer In a normal distribution data is symmetrical, so the mean, median, and mode are all equal. mea...
-
Introduction to Statistics Final Exam Questions and Correct Answers & Latest Updated
- Exam (elaborations) • 10 pages • 2024
- Available in package deal
-
- $9.99
- + learn more
One year a survey asked a group of people from a certain country the following question, "How many foreign languages do you know?" Of the 857 people who responded, 66% reported knowing only 1 foreign language. Identify the sample. o :## The sample is the 857 people who responded A poll of about 1200 people between the ages of 50 and 64 asked "How concerned are you about the problem of natural disasters?" The possible responses were very concerned, somewhat concerned, not very conce...
-
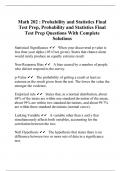
Math 202 : Probability and Statistics Final Test Prep, Probability and Statistics Final Test Prep Questions With Complete Solutions
- Exam (elaborations) • 42 pages • 2023
- Available in package deal
-
- $12.99
- + learn more
Statistical Significance When your discovered p-value is less than your alpha (.05 if not given). States that chance alone would rarely produce an equally extreme result. Non-Response Bias A bias caused by a number of people who did not respond to the survey. p-Value The probability of getting a result at least as extreme as the result given from the test. The lower the value the stronger the evidence. Empirical rule States that, in a normal distribution, about 68% of the te...

That summary you just bought made someone very happy. Also get paid weekly? Sell your study resources on Stuvia! Discover all about earning on Stuvia


