Stat 200 week 3 homework - Study guides, Class notes & Summaries
Looking for the best study guides, study notes and summaries about Stat 200 week 3 homework? On this page you'll find 139 study documents about Stat 200 week 3 homework.
Page 4 out of 139 results
Sort by
-
Exam (elaborations) STAT 200 Week 1 Homework Problems STAT 200 Week 1 Homework Problems 1.1.4 To estimate the percentage of households in Connecticut which use fuel oil as a heating source, a researcher collects information from 1000 Connecticut household
- Exam (elaborations) • 4 pages • 2022
-
- $12.39
- + learn more
Exam (elaborations) STAT 200 Week 1 Homework Problems STAT 200 Week 1 Homework Problems 1.1.4 To estimate the percentage of households in Connecticut which use fuel oil as a heating source, a researcher collects information from 1000 Connecticut households about what fuel is their heating source. State the individual, variable, population, sample, parameter, and statistic Individual - Households in Connecticut. Variable - Percentage of households in Connecticut which use fuel oil as a heating ...
-
STAT 200 Week 6 Homework Problems, full solution guide, 100% correct.
- Other • 10 pages • 2022
-
- $12.49
- + learn more
STAT 200 Week 6 Homework Problems Rubric Correct Answers with no work shown or partial work shown to justify the answer is graded at 50%. 1. Many high school students take the AP tests in different subject areas. In 2007, of the 144,796 students who took the biology exam 84,000 of them were female. In that same year, of the 211,693 students who took the calculus AB exam 102,598 of them were female ("AP exam scores," 2013). Estimate the difference in the proportion of female students ta...
STAT 200 Week 3 Homework Problems.

-
STAT 200 Week 3 Homework Problems
- Exam (elaborations) • 6 pages • 2022
-
- $7.99
- + learn more
STAT 200 Week 3 Homework Problems. A project conducted by the Australian Federal Office of Road Safety asked people many questions about their cars. One question was the reason that a person chooses a given car, and that data is in table #4.1.4 ("Car preferences," 2013). Table #4.1.4: Reason for Choosing a Car Safety Reliability Cost Performance Comfort Looks 84 62 46 34 47 27 Find the probability a person chooses a car for each of the given reasons. Total: 84+62+46+34+47+27=300 Safety...

-
STAT 200 Week 3 Homework Problems
- Exam (elaborations) • 6 pages • 2022
-
- $9.49
- + learn more
STAT 200 Week 3 Homework Problems. A project conducted by the Australian Federal Office of Road Safety asked people many questions about their cars. One question was the reason that a person chooses a given car, and that data is in table #4.1.4 ("Car preferences," 2013). Table #4.1.4: Reason for Choosing a Car Safety Reliability Cost Performance Comfort Looks 84 62 46 34 47 27 Find the probability a person chooses a car for each of the given reasons. Total: 84+62+46+34+47+27=300 Safety...
-
STAT 200 Week 3 Homework Problems / STAT200 Week 3 Homework Problems | 100% Correct, Already Graded A | Rated 100%
- Exam (elaborations) • 6 pages • 2021
- Available in package deal
-
- $8.49
- + learn more
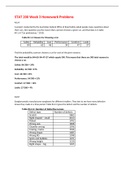
STAT 200 Week 3 Homework Problems 4.1.4 A project conducted by the Australian Federal Office of Road Safety asked people many questions about their cars. One question was the reason that a person chooses a given car, and that data is in table #4.1.4 ("Car preferences," 2013). Table #4.1.4: Reason for Choosing a Car Safety Reliability Cost Performance Comfort Looks 84 62 46 34 47 27 Find the probability a person chooses a car for each of the given reasons. 4.2.2 Eyeglassomatic manufactures eyegla...
-
STAT 200 Week 3 Homework Problems / STAT200 Week 3 Homework Problems
- Exam (elaborations) • 6 pages • 2021
-
- $8.99
- + learn more
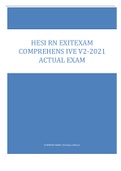
STAT 200 Week 3 Homework Problems 4.1.4 A project conducted by the Australian Federal Office of Road Safety asked people many questions about their cars. One question was the reason that a person chooses a given car, and that data is in table #4.1.4 ("Car preferences," 2013). Table #4.1.4: Reason for Choosing a Car Safety Reliability Cost Performance Comfort Looks 84 62 46 34 47 27 Find the probability a person chooses a car for each of the given reasons. 4.2.2 Eyeglassomatic manufactures eyeg...
-
HESI RN EXITEXAM COMPREHENS IVE V2-2021 ACTUAL EXAM
- Exam (elaborations) • 28 pages • 2022
-
- $17.49
- + learn more
[COMPANY NAME] [Company address] HESI RN EXITEXAM COMPREHENS IVE V2-2021 ACTUAL EXAM HESI RN EXIT EXAM COMPREHENS IVE V2-2021 ACTUAL EXAM 1. The school nurse is preparing a presentation for an elementary school teacher to inform them about when a child should be referred to the school clinic for further follow-up. The teachers should be instructed to report which situations to the school nurse? (Select all that apply) a. Refusesto complete written homework assignments b. Thirst a...
-
University of Maryland - STAT 200; Week 7 Homework Problems 2019/20 Latest Graded A Solutions.
- Exam (elaborations) • 10 pages • 2021
-
- $10.49
- 1x sold
- + learn more
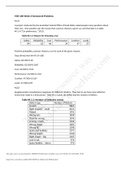
STAT 200; Week 7 Homework Problems THE TABLE FOR EACH QUESTION PLUST THE FULL QUESTIONS CAN BE FOUND IN THE ATTATCHMENT!!!!!!!! 1 table #10.1.6 contains the value of the house and the amount of re ntal income in a year that the house brings in ("Capital and rental," 2013). Create a scatter plot and find a regression equation between house value and rental income. Then use the regression equation to find the rental income a house worth $230,000 and for a house worth $400,000. Which rental incom...
-
STAT 200 Week 3 Homework Problems.
- Exam (elaborations) • 5 pages • 2021
-
- $8.49
- + learn more
STAT 200 Week 3 Homework Problems 4.1.4 A project conducted by the Australian Federal Office of Road Safety asked people many questions about their cars. One question was the reason that a person chooses a given car, and that data is in table #4.1.4 ("Car preferences," 2013). Table #4.1.4: Reason for Choosing a Car Safety Reliability Cost Performance Comfort Looks 84 62 46 34 47 27 Find the probability a person chooses a car for each of the given reasons. 4.2.2 Eyeglassomatic manufactures eyeg...

Did you know that on average a seller on Stuvia earns $82 per month selling study resources? Hmm, hint, hint. Discover all about earning on Stuvia

