Relative frequency - Study guides, Class notes & Summaries
Looking for the best study guides, study notes and summaries about Relative frequency? On this page you'll find 5896 study documents about Relative frequency.
Page 4 out of 5.896 results
Sort by
-
NSG-522 Midterm Questions and Correct Answers | Latest Update
- Exam (elaborations) • 29 pages • 2024
- Available in package deal
-
- $12.49
- + learn more
The frequency and relative frequency presented as a percentage should both be reported when describing interval level data False What type of graphic display would be the best for a variable measured at the ordinal data? Histogram The operational definition of a variable Specifies how a variable should be measured The epidemiological range is the minimum and maximum values When reporting the mean for a variable, what measure of spread should be reported? The standard deviatio...
-
UWF: EDF 6225-Foundations of ABA (Exam 1) 141 Questions with Verified Answers,100% CORRECT
- Exam (elaborations) • 20 pages • 2023
-
- $11.69
- 1x sold
- + learn more
UWF: EDF 6225-Foundations of ABA (Exam 1) 141 Questions with Verified Answers Although most of you are preparing for the BACB certification exam, please know that the material is based on the work of ________ and his science and philosophy of human behavior. There are occasions where we may spend time on items that are no longer specifically required for the exam, but we feel are required to be an excellent behavior scientist. - CORRECT ANSWER B.F. Skinner The ________ is the only standard...
-
WITS Certification Practice Exam | 200 Questions with 100% Correct Answers | Verified | Latest Update | 58 Pages
- Exam (elaborations) • 58 pages • 2023
- Available in package deal
-
- $18.49
- 1x sold
- + learn more
During the initial consultation with a client you discover they regularly smoke. This type of risk factor falls into which category? (p. 5) A) Inherited B) Environmental C) Behavioral D) Biological - Behavioral When discussing the FITT principle, how often an activity is done refers to: (p. 6) A) Frequency B) Intensity C) Time D) Type - Frequency The degree of effort required to expend energy and is influenced by cardiorespiratory fitness (CRF) or maximal aerobic power is: (p.6) A) ...
-
Introduction to Statistics - final exam Questions and Correct Verified Answers Highly Recommended Version For 2024-2025 Already A Graded|New and Revised!!!
- Exam (elaborations) • 44 pages • 2024
- Available in package deal
-
- $13.49
- + learn more
average - - also called mean; a number that describes the central tendency of the data - a number that describes the central tendency of the data; there are a number of specialized averages, including the arithmetic mean, weighted mean, median, mode, and geometric mean. blinding - not telling participants which treatment a subject is receiving categorical variable - variables that take on values that are names or labels cluster sampling - a method for selecting a random sampli...
-
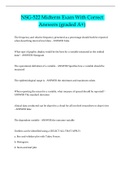
NSG-522 Midterm Exam With Correct Answers (graded A+)
- Exam (elaborations) • 19 pages • 2023
- Available in package deal
-
- $9.49
- 8x sold
- + learn more
NSG-522 Midterm Exam With Correct Answers (graded A+)...
-
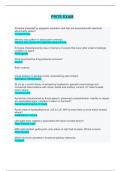
PRITE EXAM (2024/2025) - Questions and Answers (Complete Solutions)
- Exam (elaborations) • 116 pages • 2024
-
- $36.49
- 4x sold
- + learn more
PRITE EXAM (2024/2025) - Questions and Answers (Complete Solutions) Amnesia preceded by epigastric sensation and fear are associated with electrical abnormality where? Temporal lobe Memory loss pattern in dissociative amnesia Memory loss occurs for a discrete period of time Amnesia characterized by loss of memory of events that occur after onset of etiologic condition or agent Anterograde What psychoactive drug produces amnesia? Alcohol Brain Lesions ... Visual problem in pituitary tumor compr...
-
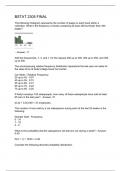
BSTAT 2305 FINAL Q&A
- Exam (elaborations) • 26 pages • 2023
-
- $14.99
- + learn more
The following histogram represents the number of pages in each book within a collection. What is the frequency of books containing at least 250 but fewer than 400 pages? - Answer- 11 Add the frequencies, 7, 3, and 1, for the classes 250 up to 300, 300 up to 350, and 350 up to 400. The accompanying relative frequency distribution represents the last year car sales for the sales force at Kelly's Mega Used Car Center. Car Sales - Relative Frequency 35 up to 45 - 0.07 45 up to ...
-
Test Bank for Business Statistics Communicating With Numbers 2nd Edition Jaggia Full Chapter 2024/2025
- Exam (elaborations) • 203 pages • 2024
-
- $33.49
- + learn more
Test Bank for Business Statistics Communicating With Numbers 2nd Edition Jaggia Full Chapters 2024/2025. The relative frequency of a category is calculated by dividing the category's frequency by the total number of observations. True False 3. The percent frequency of a category equals the frequency of the category multiplied by 100%. True False 4. A pie chart is a segmented circle that portrays the categories and relative sizes of some quantitative variable. True False 5. A bar chart d...
-
ASVAB MEPS Exam 223 Questions with Verified Answers,100% CORRECT
- Exam (elaborations) • 24 pages • 2023
-
- $12.99
- 2x sold
- + learn more
ASVAB MEPS Exam 223 Questions with Verified Answers A radar is designed to report the track of an aircraft every second. If this radar reports 30 tracks in one minute, what percentage of the time did the radar track the aircraft? - CORRECT ANSWER 50% Jerry walked a dog from 6:40 a.m. to 7:30 a.m. one day. If he was paid at the rate of $6 per hour, how much did he earn that day? - CORRECT ANSWER $5.00 A woman is looking for a bigger square office. She finds an office twice the area of he...
-
Test Bank for Business Statistics Communicating With Numbers 2nd Edition Jaggia Full Chapter 2024/2025
- Exam (elaborations) • 203 pages • 2024
-
- $30.49
- + learn more
Test Bank for Business Statistics Communicating With Numbers 2nd Edition Jaggia Full Chapterss 2024/2025. The relative frequency of a category is calculated by dividing the category's frequency by the total number of observations. True False 3. The percent frequency of a category equals the frequency of the category multiplied by 100%. True False 4. A pie chart is a segmented circle that portrays the categories and relative sizes of some quantitative variable. True False 5. A bar chart ...

That summary you just bought made someone very happy. Also get paid weekly? Sell your study resources on Stuvia! Discover all about earning on Stuvia


