Conditional percentages - Study guides, Class notes & Summaries
Looking for the best study guides, study notes and summaries about Conditional percentages? On this page you'll find 97 study documents about Conditional percentages.
Page 4 out of 97 results
Sort by
-
WGU C784-Statistics Mod 5
- Exam (elaborations) • 30 pages • 2023
-
- $12.39
- + learn more
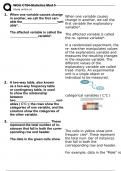
1. When one variable causes change in another, we call the first vari- able the vari- able*. The affected variable is called the variable*. 2. A two-way table, also known as a two-way frequency table or contingency table, is used to show the relationship between two vari- ables ( C’C ); the rows show the categories of one variable, and the columns show the categories of the other variable. 3. . These represent the total number of in- stances that fall in both the corre- sponding...
-
Summary WGU C955 Applied Probability and Statistics All Terms and Formulas (2023 / 2024) (Verified)
- Summary • 26 pages • 2023
-
- $13.99
- + learn more
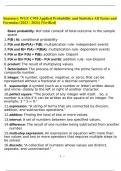
Summary WGU C955 Applied Probability and Statistics All Terms and Formulas (2023 / 2024) (Verified) Basic probability: #of total come# of total outcome in the sample space 1. P(B | A): conditional probability 2. P(A and B)=P(A) • P(B): multiplication rule- independent events 3. P(A and B)= P(A) • P(B|A): multiplication rule- dependent events 4. P(A or B)= P(A) + P(B): addition rule- Disjoint 5. P(A or B)= P(A) + P(B) - P(A and B): addition rule- non-Disjoint 6. product: The result...
-
WGU C955 Exam Questions & Answers 100% Correct
- Exam (elaborations) • 4 pages • 2023
-
- $11.49
- + learn more
Histogram - when to use - ANSWER-Based on the shape of the distribution, uses mean + standard deviation OR median + IQR to describe center and spread - Larger data sets; shows shapes of distribution and potential outliers; ignores the individual data valuesl Histogram Skewed right - ANSWER-Not a symmetric distribution, the tail is on the right Standard Deviation Rule - ANSWER-68% of the data are within 1 standard deviation, 95% are within 2, 99.7% are within 3 standard deviation...
-
Statistics final wgu academy Questions And Answers With Correct Solutions
- Exam (elaborations) • 5 pages • 2024
- Available in package deal
-
- $9.99
- + learn more
WGU STatistics Test nominal variables - ANS Categorical variables that there is no natural order among the categories ordinal variable - ANS Categorical variables where there is natural order among the categories (low-high) interval - ANS A measurement which makes sense to talk about the difference between values but not the ratio between values ratio - ANS Quantitive variables where is makes sense to talk about the difference in ratios. (Income, weigh...

-
Test Bank For Business Analytics Data Analysis & Decision Making 6th Edition By S. Christian Albright
- Exam (elaborations) • 567 pages • 2023
-
- $31.83
- + learn more
Ch3 1. To examine relationships between two categorical variables, we can use: a. b. c. d. ANSWER: POINTS: DIFFICULTY: TOPICS: OTHER: counts and corresponding charts of the counts scatter plots histograms none of these choices a 1 Easy | Bloom's: Knowledge A-Head: 3-2 Relationships Among Categorical Variables BUSPROG: Analytic | DISC: Descriptive Statistics 2. Tables used to display counts of a categorical variable are called: a. crosstabs b. contingency tables c. either crosstabs ...
-
C955 wrap before oa question with complete solution 2023 already passed
- Exam (elaborations) • 8 pages • 2023
- Available in package deal
-
- $9.99
- + learn more
C955 wrap before oa question with complete solution 2023 already passedJust categorical - correct answer pie chart ( part of a whole ) or bar chart just quantitative - correct answer histogram ( for intervals) stem plot ( for exact values ) or boxplot or dot plot ( less common) categorical > categorical - correct answer contingency - (two way) table to create conditional percentages Quantitative > Quantitative - correct answer scatterplot and use correlation coefficient categor...
-
C784 Statistics FULL COURSE REVIEW questions and answers well illustrated.
- Exam (elaborations) • 5 pages • 2023
- Available in package deal
-
- $13.49
- + learn more
C784 Statistics FULL COURSE REVIEW questions and answers well illustrated. Lurking Variable - correct answers.Associated with the explanatory and the response variables that is not directly being studied. Simpson's Paradox - correct answers.Occurs when a trend or result that appears in groups of data disappears when we combine the data. Regression Analysis - correct answers.A process for estimating and analyzing the relationship between variables. Least-Squares Regress...
-
WGU C784 Statistics FULL COURSE REVIEW Graded A+
- Exam (elaborations) • 5 pages • 2023
-
- $11.49
- + learn more
Lurking Variable - Associated with the explanatory and the response variables that is not directly being studied. Simpson's Paradox - Occurs when a trend or result that appears in groups of data disappears when we combine the data. Regression Analysis - A process for estimating and analyzing the relationship between variables. Least-Squares Regression Line - AKA the line of best fit. y = mx + b "rise over run" Interpolation - Using existing data along with the Least-Squares Re...

-
Test Bank For Business Analytics Data Analysis & Decision Making, 6th Edition by S. Christian Albright
- Exam (elaborations) • 567 pages • 2023
-
- $31.83
- + learn more
Ch3 1. To examine relationships between two categorical variables, we can use: a. b. c. d. ANSWER: POINTS: DIFFICULTY: TOPICS: OTHER: counts and corresponding charts of the counts scatter plots histograms none of these choices a 1 Easy | Bloom's: Knowledge A-Head: 3-2 Relationships Among Categorical Variables BUSPROG: Analytic | DISC: Descriptive Statistics 2. Tables used to display counts of a categorical variable are called: a. crosstabs b. contingency tables c. either crosstabs ...

-
Test Bank For Business Analytics Data Analysis and Decision Making 6th Edition Albright
- Exam (elaborations) • 558 pages • 2023
-
- $31.83
- + learn more
1. To examine relationships between two categorical variables, we can use: a. counts and corresponding charts of the counts b. scatter plots c. histograms d. none of these choices ANSWER: a POINTS: 1 DIFFICULTY: Easy | Bloom's: Knowledge TOPICS: A-Head: 3-2 Relationships Among Categorical Variables OTHER: BUSPROG: Analytic | DISC: Descriptive Statistics 2. Tables used to display counts of a categorical variable are called: a. crosstabs b. contingency tab...

Do you wonder why so many students wear nice clothes, have money to spare and enjoy tons of free time? Well, they sell on Stuvia! Imagine your study notes being downloaded a dozen times for $15 each. Every. Single. Day. Discover all about earning on Stuvia


