Bar chart - Study guides, Class notes & Summaries
Looking for the best study guides, study notes and summaries about Bar chart? On this page you'll find 4290 study documents about Bar chart.
Page 4 out of 4.290 results
Sort by
-
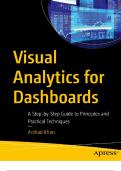
Visual Analytics for Dashboards A Step-by-Step Guide to Principles and Practical Techniques 2024 with complete solution;Chapter 1-11
- Exam (elaborations) • 191 pages • 2024
-
- $30.49
- + learn more
Visual Analytics for Dashboards A Step-by-Step Guide to Principles and Practical Techniques 2024 with complete solution Table of Contents Chapter 1: Dashboards Business Intelligence Objective and Technologies Defining Business Intelligence Business Intelligence Tools Convergence of Disciplines Background Business Dashboard Predecessor Change in User Needs Major Changes Since the 1990s Dashboards Car Dashboard Business Dashboard Definition Objective Key Features Process Suppor...
-
Nursing Informatics Certification Exam, ANCC Informatics, ANCC Nursing Informatics Certification Review 629 Questions with Answers,100% CORRECT
- Exam (elaborations) • 110 pages • 2024
-
- $15.99
- 1x sold
- + learn more
Nursing Informatics Certification Exam, ANCC Informatics, ANCC Nursing Informatics Certification Review 629 Questions with Answers Meta structure of NI - CORRECT ANSWER The ability of the nurse to utilize data, information, and knowledge to make wise clinical decisions. Definition of Nursing Informatics - CORRECT ANSWER A speciality that integrates nursing science with multiple information and analytical sciences to identify, define, manage and communicate data, information, knowledge and ...
-
D467 - Exploring Data Questions and Answers Already Passed
- Exam (elaborations) • 61 pages • 2024
- Available in package deal
-
- $11.99
- + learn more
D467 - Exploring Data Questions and Answers Already Passed What type of chart is commonly used to visualize the distribution of a numerical variable? a. Bar chart b. Histogram c. Pie chart d. Line graph Which of the following is a method for detecting outliers in a dataset? a. Mean b. Box plot c. Mode d. Range What does the term "data cleaning" refer to? a. Storing data securely b. Removing duplicates from a dataset c. Correcting or removing inaccurate records 2...
-
LOMA 308 Module 3 Exam Questions and Answers All Correct
- Exam (elaborations) • 45 pages • 2024
-
- $13.49
- + learn more
LOMA 308 Module 3 Exam Questions and Answers All Correct A graphical scheduling tool that separates projects into critical activities and plots starting and ending dates for each activity. Flow chart Gantt chart PERT network - Answer-Gantt chart A project scheduling tool that helps shorten the length of time needed to complete large, complex projects. Flow chart Gantt chart PERT network - Answer-PERT network A graphic representation of a sequence of activities and decisions. Flow ...
-
WGU - MBA - C207 - Data Driven Decision Making questions with correct answers
- Exam (elaborations) • 27 pages • 2023
- Available in package deal
-
- $11.99
- 1x sold
- + learn more
Activities (RBM stage) - answer second step involves the process that converts inputs to outputs (actions necessary to produces results - training, evaluating, developing) Alternative hypothesis - answer The argument that either a sample is not equal to, greater than, or less than the hypothesized null sample Analysis of Variance (ANOVA) - answer a technique used to determine if there is a sufficient evidence from sample data of three or more populations to conclude that the means of the p...
-
Power BI Questions and Answers Already Graded A
- Exam (elaborations) • 18 pages • 2024
- Available in package deal
-
- $9.99
- + learn more
Power BI Questions and Answers Already Graded A Which of the following can be used to perform calculations across multiple tables in Power BI? A) Excel B) DAX measures C) Power Query Editor D) Report view B) DAX measures What does the "Power BI Service" allow users to do that Power BI Desktop does not? A) Create data models B) Share and collaborate on reports and dashboards C) Create new calculated columns D) Perform advanced data cleaning B) Share and collaborate on r...
-
SAR MIS112 EXAM QUESTIONS WITH ALL CORRECT ANSWERS
- Exam (elaborations) • 17 pages • 2024
-
- $12.49
- + learn more
SAR MIS112 EXAM QUESTIONS WITH ALL CORRECT ANSWERS Which of the following is an object that contains the actual data in the chart? Plot area Pie area Bar area Column are - Answer-Plot area Fill in the blank: Every chart type has a set of ____ that you can choose from (with settings for chart elements such as a title, data labels, axes, and so on). Shapes Categories Layouts Attributes - Answer-Layouts Examine the attached workbook. If you want to remove chart label...
-
MISY 5325 Excel Midterm Ultimate Review with Complete Solutions
- Exam (elaborations) • 180 pages • 2024
- Available in package deal
-
- $12.99
- + learn more
MISY 5325 Excel Midterm Ultimate Review with Complete Solutions Pressing the Ctrl key is required to select cells or ranges of cells that are not adjacent. To relocate a chart to another worksheet, users should employ the function **move chart**. If entered correctly, the functions SUMIF and DSUM will produce the same result. Which cell reference remains unchanged when formulas are copied and pasted into other cells? $A$1 (Absolute Reference) Which statement regarding the Ta...
-
Tableau Desktop Specialist Exam Questions and Answers 2024/2025 Score A+.
- Exam (elaborations) • 48 pages • 2024
-
- $12.99
- + learn more
Tableau Desktop Specialist Exam Questions and Answers 2024/2025 Score A+. Which of the following is the best reason to create a saved data source as a .TDS file? a. Those who wish to use the data do not have access to the underlying data. b. You want to save the default field properties such as number formats and sort order. c. You want to save a snapshot of the data that will not update even when the underlying data changes. d. You need to apply an aggregation that takes too long when ...
-
MNO2602 ASSIGNMENT 5 2024 SEMESTER 2 1.1. The Social Environment of a Globalising Organisation 2 1.2. Difference Between Prevention, Appraisal, and Failure (PAF) Costs 2 1.3. Forms of Power in Leadership 3 1.4. Conditions a Guarantee Should Adhere To 3 1
- Essay • 18 pages • 2024
-
- $2.99
- + learn more
MNO2602 ASSIGNMENT 5 2024 SEMESTER 2 1.1. The Social Environment of a Globalising Organisation 2 1.2. Difference Between Prevention, Appraisal, and Failure (PAF) Costs 2 1.3. Forms of Power in Leadership 3 1.4. Conditions a Guarantee Should Adhere To 3 1.5. Service Blueprinting 4 1.6. Technology Feasibility Statement in Product Development 4 1.7. Garvin’s Five Definitions of Quality 5 1.8. Distinguishing Between Services and Manufactured Goods 5 1.9. Commonly Benchmarked Performance...

Study stress? For sellers on Stuvia, these are actually golden times. KA-CHING! Earn from your study resources too and start uploading now. Discover all about earning on Stuvia


