Sample standard deviation - Study guides, Class notes & Summaries
Looking for the best study guides, study notes and summaries about Sample standard deviation? On this page you'll find 4406 study documents about Sample standard deviation.
Page 3 out of 4.406 results
Sort by
-
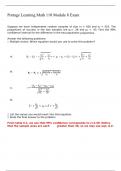
MATH 110 Module 8 Exam Scored 100% - Portage Learning 2023
- Exam (elaborations) • 10 pages • 2024
- Available in package deal
-
- $17.00
- 1x sold
- + learn more
MATH 110 Module 8 Exam Scored 100% - Portage Learning. Suppose we have independent random samples of size n1 = 615 and n2 = 505. The proportions of success in the two samples are p1= .53 and p2 = .45. Find the 90% confidence interval for the difference in the two population proportions. Answer the following questions: 1. Multiple choice: Which equation would you use to solve this problem? A. B. C. D. 2. List the values you would insert into that equation. 3. State the final answer to the problem...
![AQA A-level FURTHER MATHEMATICS 7367/3S Paper 3 Statistics Version: 1.0 Final PB/KL/Jun23/E3 7367/3S A-level FURTHER MATHEMATICS Paper 3 Statistics Time allowed: 2 hoursQUESTION PAPER & MARKING SCHEME/ [MERGED] Mark scheme June 2023](/docpics/4377621/65b991beb7db0_4377621_121_171.jpeg)
-
AQA A-level FURTHER MATHEMATICS 7367/3S Paper 3 Statistics Version: 1.0 Final PB/KL/Jun23/E3 7367/3S A-level FURTHER MATHEMATICS Paper 3 Statistics Time allowed: 2 hoursQUESTION PAPER & MARKING SCHEME/ [MERGED] Mark scheme June 2023
- Exam (elaborations) • 31 pages • 2024
-
- $7.99
- 1x sold
- + learn more
AQA A-level FURTHER MATHEMATICS 7367/3S Paper 3 Statistics Version: 1.0 Final PB/KL/Jun23/E3 7367/3S A-level FURTHER MATHEMATICS Paper 3 Statistics Time allowed: 2 hours Materials l You must have the AQA Formulae and statistical tables booklet for A‑level Mathematics and A‑level Further Mathematics. l You should have a graphical or scientific calculator that meets the requirements of the specification. l You must ensure you have the other optional Question Paper/Answer Book ...
-
MIP2602 Assignment 4 (QUALITY ANSWERS) 2024
- Exam (elaborations) • 14 pages • 2024
-
- $2.84
- 1x sold
- + learn more
This document contains workings, explanations and solutions to the MIP2602 Assignment 4 (QUALITY ANSWERS) 2024. For assistance whats-app us on 0.6.8..8.1.2..0.9.3.4... Question 1 1.1 Read the scenario below and answer the questions that follow: Mrs Mbeki conducted a survey to find out how many coins the learners in Grade 5 at IMMACULATE CONVENT school had on them (in their pockets or purses). Mrs Mbeki randomly surveyed 40 Grade 5 learners at IMMACULATE CONVENT school. She obtained the follo...
-
MATH 110 MODULE 6 EXAM 2024. WITH 100% CORRECT AND VERIFIED ANSWERS. LATEST 2024 UPDATE GUARANTEED A+ SCORE.
- Exam (elaborations) • 14 pages • 2024
-
- $9.48
- 1x sold
- + learn more
Question 1 10 / 10 pts You may find the following files helpful throughout the exam: Statistics_Equation_Sheet (Links to an external site.) Standard Normal Table (Links to an external site.) T Table (Links to an external site.) A new drug is introduced that is supposed to reduce fevers. Tests are done with the drug. The drug is given to 55 people who have fevers. It is found that the mean time that it takes for the fever to get back to normal for this test group is 380 minutes with a ...
-
Six Sigma Green Belt Practice Questions study guide questions and answers 2024
- Exam (elaborations) • 14 pages • 2024
-
- $14.99
- 1x sold
- + learn more
This is a bizarre question. It never mentions that the financial savings should be reported at the annual level. However, that's a reasonable assumption to make. $7,500 * 12 months = $90, 000. A shoe manufacturing firm learned through a Lean Six Sigma project their boot soles could be made of a different material requiring two less steps in the process. Removal of these two steps yielded a monthly cost savings of $7,500. Therefore the reported financial savings for this LSS project were: A) $...
-
WGU C955 Probability and Statistics (2022/2023) Already Passed
- Exam (elaborations) • 8 pages • 2023
- Available in package deal
-
- $9.99
- 1x sold
- + learn more
WGU C955 Probability and Statistics (2022/2023) Already Passed Boxplot an image that has min, Q1, median, Q3, max Histogram A graphical representation -- bars, measuring the frequency within each interval Skewed right Not a symmetric distribution, the tail is on the right, i.e. extra stuff on the right Measures of center Median, the mean (and mode) Measures of spread Range, IQR & standard deviation Standard Deviation Rule 68% of the data are within 1 standard deviation, 95% are within 2, 99...
-
BMAL 590 Quantitative Research Techniques Questions (solved to Pass)
- Exam (elaborations) • 53 pages • 2023
-
- $8.49
- 1x sold
- + learn more
BMAL 590 Quantitative Research Techniques Questions (solved to Pass). You take a random sample of 100 students at your university and find that their average GPA is 3.1. If you use this information to help you estimate the average GPA for all students at your university, then you are doing what branch of statistics? Descriptive statistics Inferential statistics Sample statistics Population statistics -A company has developed a new computer sound card whose average lifetime is unknown. In order t...
-
TEST BANK FOR TIETZ FUNDAMENTALS OF CLINICAL CHEMISTRY AND MOLECULAR DIAGNOSTICS 7TH EDITION BY BURTIS
- Exam (elaborations) • 67 pages • 2023
-
- $16.49
- 1x sold
- + learn more
TEST BANK FOR TIETZ FUNDAMENTALS OF CLINICAL CHEMISTRY AND MOLECULAR DIAGNOSTICS 7TH EDITION BY BURTIS Table of Contents PREFACE ............................................................................................................................................... 2 Chapter 01: Clinical Chemistry, Molecular Diagnostics, and Laboratory Medicine ...................... 2 Chapter 02: Selection and Analytical Evaluation of Methods With Statistical Techniques .......... 5 Chapter 03: Clinical...
-
Solutions for Elementary Statistics: Picturing the World, 8th edition Larson
- Exam (elaborations) • 630 pages • 2023
-
- $29.49
- 1x sold
- + learn more
Complete Solutions Manual for Elementary Statistics: Picturing the World, 8th edition 8th Edition by Ron Larson. ISBN-13: 3470 Full Chapters Solutions are included I. DESCRIPTIVE STATISTICS Introduction to Statistics 1.1 An Overview of Statistics 1.2 Data Classification 1.3 Data Collection and Experimental Design Descriptive Statistics 2.1 Frequency Distributions and Their Graphs 2.2 More Graphs and Displays 2.3 Measures of Central Tendency 2.4 Measures of Var...
-
CMT level 3 | updated questions and answers
- Exam (elaborations) • 32 pages • 2023
- Available in package deal
-
- $9.49
- 1x sold
- + learn more
CMT level 3 | updated questions and answers A strong open followed by strong close will allow trader to do what? - Buy on a pullback after next open. A weak close after strong open will allow trader to do what? - Sell short near following open Highs and lows occur where during the day? - Most often at the open Large opening gaps imply what about the day? - Greater volatility Pivot point calculation - P = (H+L+C)/3 R1 = 2P-L S1 = 2P-H R2 = (P-S1)+R1 S2 = P-(R1-S1) Weaknesses...

$6.50 for your textbook summary multiplied by 100 fellow students... Do the math: that's a lot of money! Don't be a thief of your own wallet and start uploading yours now. Discover all about earning on Stuvia


