Math534 - Study guides, Class notes & Summaries
Looking for the best study guides, study notes and summaries about Math534? On this page you'll find 244 study documents about Math534.
Page 2 out of 244 results
Sort by
-
MATH 534 Week 7 Discussion; Predictive Analytics
- Other • 71 pages • 2023
- Available in package deal
-
- $15.99
- + learn more
Predictive analytics in business is an important application of multiple regression analysis.Generallyspeaking,whatismeantbypredictiveanalytics?Asabusinessowner,howcouldyouuseregressionanalysisand predictive analyticsto increase your company'ssales?
-
MATH 534 Week 4 Discussion; Confidence Intervals in Business
- Other • 91 pages • 2023
- Available in package deal
-
- $18.48
- + learn more
Consider when businesses might use confidence intervals to estimate values, such asin sales projections, marketing results, and so forth. Describe a business decision thatcould be helped with confidence intervals. Be specific! Then create a problem withnumbers from which another student could calculate a confidence interval and make adecision.
-
MATH 534 Week 7 Discussion; Predictive Analytics
- Other • 71 pages • 2023
- Available in package deal
-
- $18.48
- + learn more
Predictive analytics in business is an important application of multiple regression analysis.Generallyspeaking,whatismeantbypredictiveanalytics?Asabusinessowner,howcouldyouuseregressionanalysisand predictive analyticsto increase your company'ssales?
-
MATH 534 Week 6 Discussion; Regression Analysis
- Other • 59 pages • 2023
- Available in package deal
-
- $18.48
- + learn more
Suppose you are given data from a survey showing the IQ of each person interviewed and the IQof his or her mother. That is all the information that you have. Your boss has asked you to puttogether a report showing the relationship between these two variables. What could you present,and why?
-
MATH 534 Week 4 Quiz (v2)
- Exam (elaborations) • 64 pages • 2023
- Available in package deal
-
- $25.48
- + learn more
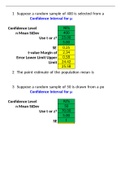
1. Question: Suppose a random sample of 400 is selected from a population with a standard deviation of 5. If the sample mean is 25, the 98% confidence interval to estimate the population mean is between ________. 2. Question: The point estimate of the population mean is _________. 3. Question: Suppose a random sample of 50 is drawn from a population whose standard deviation is unknown. If the sample mean is 70 and the sample standard deviation is 5, the 92% confidence interval to estimate the ...
-
MATH 534 Week 1 Discussion; Study and Sample Design
- Other • 74 pages • 2023
- Available in package deal
-
- $18.48
- + learn more
A company makes men's button-up dress shirts and is considering changes to itsdesign.Howmightthecompanygoaboutfindingagoodsampleofindividuals?Thesedecisions would include method of sampling, location of sampling, population toconsider,and numberin sample,inaddition toanyotherconsiderations.
-
MATH 534 Week 3 Discussion; Determining a Normal Distribution
- Other • 99 pages • 2023
- Available in package deal
-
- $17.99
- + learn more
When trying to determine probabilities, one must first assess whether the variable wouldhave anormaldistribution. Usingthetoolsfromthiscourse,whataresomemethodsthatcouldbeusedtodeterminewhethera variablehasanormaldistribution?
-
MATH 534 Week 5 Discussion; Hypothesis Testing
- Other • 92 pages • 2023
- Available in package deal
-
- $18.48
- + learn more
For this discussion, create and post a 1-2 minute video describing a real-world example of whenahypothesistestcouldbeused.Yourvideoshouldalsoincludeanumericalexampleforanotherstudent to work through in their response. The example can use real data or data that you makeup, such as values for the mean, standard deviation, and sample size. Be sure to note if thestandard deviation is from the population or the sample.In your responses to other students,showtheworkand describe thestepsyou usesto solv...

-
MATH 534 : Applied Managerial Statistics PART C
- Exam (elaborations) • 8 pages • 2023
-
- $6.00
- + learn more
Regression and Correlation Analysis 1. Generate a scatterplot for the specified dependent variable (Y) and the X1 independent variable, including the graph of the "best fit" line. Interpret. Fitted Plot Line According to the Graph the linear relationship there is a positive relationship between Sales and calls. If number of calls increases the sales also increase and the same if sales increases the calls increases.
-
MATH 534 Week 3 Discussion; Determining a Normal Distribution
- Other • 99 pages • 2023
- Available in package deal
-
- $15.49
- + learn more
When trying to determine probabilities, one must first assess whether the variable wouldhave anormaldistribution. Usingthetoolsfromthiscourse,whataresomemethodsthatcouldbeusedtodeterminewhethera variablehasanormaldistribution?

$6.50 for your textbook summary multiplied by 100 fellow students... Do the math: that's a lot of money! Don't be a thief of your own wallet and start uploading yours now. Discover all about earning on Stuvia


