Summary
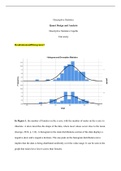
Summary Descriptive.docx Descriptive Statistics Quant Design and Analysis Descriptive Statistics Capella University ResubmissionofHistogramx2 In Figure 1, the number of females on the y-axis, with the number of males on the x-axis to illustrate. A skew desc
- Course
- Capellla
- Institution
- Capella University
D Descriptive Statistics Quant Design and Analysis Descriptive Statistics Capella University ResubmissionofHistogramx2 In Figure 1, the number of females on the y-axis, with the number of males on the x-axis to illustrate. A skew describes the shape of the data, where most values occur close ...
[Show more]


