Six Sigma Green Belt Exam Questions And Answers (Verified And Updated)
10 views 0 purchase
Course
Six Sigma Green Belt
Institution
Six Sigma Green Belt
Six Sigma Green Belt Exam Questions And
Answers (Verified And Updated)
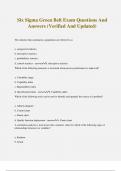
The statistics that summarize a population are referred to as
a. categorical statistics
b. descriptive statistics
c. probabilistic statistics
d. control statistics - answerb. descriptive statistics
Which of the following ...
Six Sigma Green Belt Exam Questi ons And Answers (Verified And Updated) The statistics that summarize a population are referred to as a. categorical statistics b. descriptive statistics c. probabilistic statistics d. control statistics - answer✔✔b. descriptive statistics Which of the following measures is increased when proce ss performance is improved? a. Variability range b. Capability index c. Repeatability index d. Specification limits - answer✔✔b. Capability index Which of the following tools can be used to identify and quantify the source of a problem? a. Affinity diagr am b. Control chart c. Pareto chart d. Quality function deployment - answer✔✔c. Pareto chart A correlation analysis is used to provide a numeric value for which of the following types of relationships between two variables? a. Random b. Linear c. Curvilin ear d. Causation - answer✔✔b. Linear Which of the following tools is used to translate broad requirements into specific requirements? a. A quality control plan b. The theory of constraints (TOC) c. A critical to quality (CTQ) tree d. A process flowchart - answer✔✔c. A critical to quality (CTQ) tree Which of the following tools is used extensively in quality function deployment (QFD)? a. Affinity diagram b. Matrix diagram c. Cause and effect diagram d. Activity network diagram - answer✔✔b. Matrix diagram Which of the following control charts is used to monitor discrete data? a. p b. I&mR c. Xbar d. Xbar and R - answer✔✔a. p Which of the following shapes is used to present a termination point in a flowchart? a. Rectangle b. Diamond c. Arrow d. Oval - answer✔✔d. Oval For a normal distribution, two standard deviations on each side of the mean would include what percentage of the total population? a. 95% b. 68% c. 47% d. 34% - answer✔✔a. 95% Which of the following is a commonly accepted level for alpha risk? a. 0.05 b. 0.50 c. 0.70 d. 0.95 - answer✔✔a. 0.05 When the sampling method used creates a difference between the result obtained from the sample and the actual population value, the diffe rence is known as a. Correlation b. Precision c. Accuracy d. Bias - answer✔✔d. Bias Which of the following is an example of mistake -proofing? a. Using an Xbar and R chart to prevent errors b. Using 100% inspection to detect and contain defects c. Using c olor coding as an error signal d. Having the team that created the errors repair them - answer✔✔c. Using color coding as an error signal Which of the following is the key objective of a six sigma project? a. Developing detailed control charts for critical processes b. Developing a matrix to understand the how's and what's of a problem process c. Reducing variation in critical processes d. Reducing investment costs while improving output quality - answer✔✔c. Reducing variation in critical processes Which of the following tools is used to identify potential events and contingencies for an implementation plan? a. PERT chart b. Process decision program chart c. Fishbone diagram d. House of quality - answer✔✔b. Process decision program chart Which of the following measures is used to show the ratio of defects to units? a. DPU b. DPO c. DPMO d. PPM - answer✔✔a. DPU Which of the following terms is used to describe the risk of a type I error in a hypothesis test? a. Power b. Confidence level c. Level of significance d. Beta risk - answer✔✔c. Level of significance Positional, cyclical, and temporal variations are most commonly analyzed in a. SPC charts b. Multi -vari charts c. Cause and effects diagrams
The benefits of buying summaries with Stuvia:
Guaranteed quality through customer reviews
Stuvia customers have reviewed more than 700,000 summaries. This how you know that you are buying the best documents.
Quick and easy check-out
You can quickly pay through credit card or Stuvia-credit for the summaries. There is no membership needed.
Focus on what matters
Your fellow students write the study notes themselves, which is why the documents are always reliable and up-to-date. This ensures you quickly get to the core!
Frequently asked questions
What do I get when I buy this document?
You get a PDF, available immediately after your purchase. The purchased document is accessible anytime, anywhere and indefinitely through your profile.
Satisfaction guarantee: how does it work?
Our satisfaction guarantee ensures that you always find a study document that suits you well. You fill out a form, and our customer service team takes care of the rest.
Who am I buying these notes from?
Stuvia is a marketplace, so you are not buying this document from us, but from seller TheStar. Stuvia facilitates payment to the seller.
Will I be stuck with a subscription?
No, you only buy these notes for $14.49. You're not tied to anything after your purchase.