Exam (elaborations)
stat final SOLUTIONS LATEST EDITION 2023 UPDATED&VERIFIED|100% SOLVED|GUARANTEED GRADE A+
- Course
- Institution
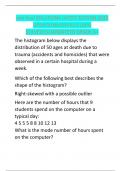
The histogram below displays the distribution of 50 ages at death due to trauma (accidents and homicides) that were observed in a certain hospital during a week. Which of the following best describes the shape of the histogram? Right-skewed with a possible outlier Here are the number o...
[Show more]